Financial visualisation website FINVIZ.com is one of my favourite trading tools. I use it every day to keep a tab on markets and look at charts.
The stock screener on Finviz is also one of the best I’ve found with more than 60 filters that can be applied to 7000 US stocks.
In the rest of this article, I will take a simple stock screen from Finviz and backtest it on historical data using the backtesting platform Amibroker. This will give us an idea of what to expect if we were to pick stocks according to the screen.
Finviz Stock Screen
As you can imagine, with over 60 filters, there are quite a number of possibilities for us to look at.
However, we are somewhat restricted because we do not have access to point in time fundamental data. In fact, it is very hard to get hold of and work with such data.
Therefore we will restrict our analysis to technical metrics only.
The Finviz screen that we are going to backtest today looks like this:
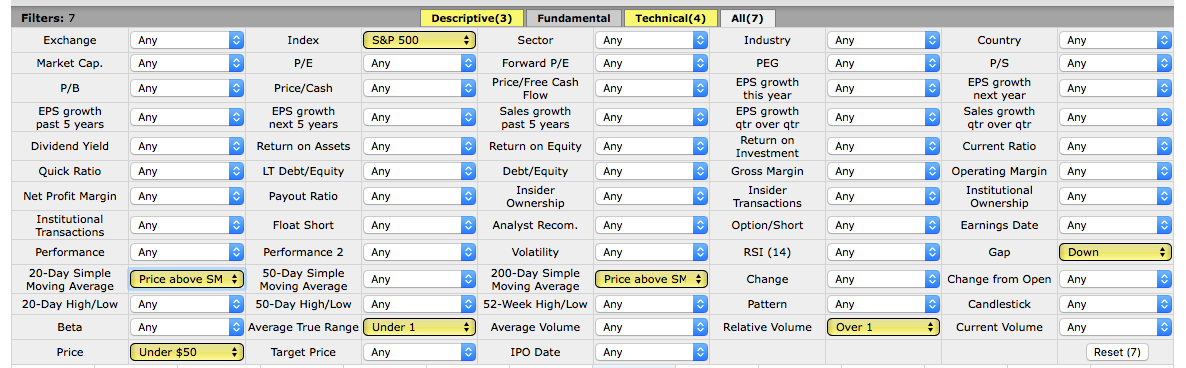
So we are looking for stocks that possess the following attributes:
- Belong to the S&P 500
- Close above the 20 day MA
- Close above the 200 day MA
- ATR(14) < 1
- Relative Volume > 1
- A Gap Down day
- Under $50 a share
Rationale
The rationale behind these rules is to find upward trending stocks that are increasing in volume and also not very volatile.
We don’t want to trade expensive tickers and we want to include a very short-term pullback by using a gap down rule.
Note that the ATR indicator that Finviz uses is slightly different to the default in Amibroker. I used the ATR as described in the Finviz documentation.
Setting Up The Test
To backtest this stock screen I will be using the backtesting program Amibroker and historical end of day data from Norgate which is adjusted for dividends and includes delisted tickers.
The following settings will be used:
- Time frame = Daily
- Initial Equity = $100,000
- Portfolio Size = Max 20 positions
- Position Size = 5% (equal weight)
- Sell Rule = By 20% trailing stop
- Execution = Next day open
- Ranking = Relative volume (largest preferred)
- Compound returns = Yes
- Commissions = $0.01 per share
To sum up, we will be buying stocks from the S&P 500 universe according to the rules of the Finviz stock screen. All signals will be computed with closing prices and all entries will be made on the next day open.
We will sell by 20% trailing stop. When the trailing stop amount is hit, the exit will take place on the next open.
In the case of duplicate signals, we will choose the stock with the highest relative volume first. You can achieve this in Finviz by sorting the relative volume column.
Relative volume refers to the daily volume divided by the 3-month average volume.
Here’s an example trade setup in MNST:
Backtest Results
The system was first run on an in-sample period between 1 January 2000 and 1 January 2014 and produced the following results and equity curve:
- Annualised Return: 12.73%
- Max Drawdown: -27.10%
- CAR/MDD: 0.47
- Win Rate: 52.16%
- Average P/L Per Trade: 18.15%
- Profit Factor: 4.95
You can see we got a pretty good result. An annualised return of 12.73% with a maximum drawdown of -27.10% and a win rate of 52.16%.
This beats the buy and hold annualised return of 3.63% with a max drawdown of -55%.
Out Of Sample Results:
The system was next run on an out-of-sample period between 1 January 2014 and 1 July 2017 and produced the following results and equity curve:
- Annualised Return: 8.45%
- Maximum Drawdown: -11.92%
- CAR/MDD: 0.71
- Win Rate: 55%
- Average P/L Per Trade: 10.01%
- Profit Factor: 4.01
You can see we also got a pretty good result in the out-of-sample test.
Although our annualised return has gone down to 8.45%, our CAR/MDD has gone up to 0.71 and every year was profitable.
However, the buy and hold annualised return was 10.51% with a max drawdown of -13.02%.
Summary
Today we looked at a simple 7 filter stock screen from the website Finviz and backtested it using historical data. Using the rules shown above, we achieved a pretty good result in both the in sample and out of sample.
It should be noted that this test was undertaken without any optimisation. I simply took some rules that seemed to make sense and put them into the backtester.
I did not search around for values until I found something that worked. In fact I only ran the backtest twice (to change portfolio size).
To counter this, it should be also said that I have of course run many backtests in the past so this will have had a bearing on the inputs I chose.
Nevertheless, this strategy seems quite solid. What is also appealing is that we navigated the 2008 bear market without need for any market timing filter. Unless I am mistaken, this system does a good job of picking out trending stocks.
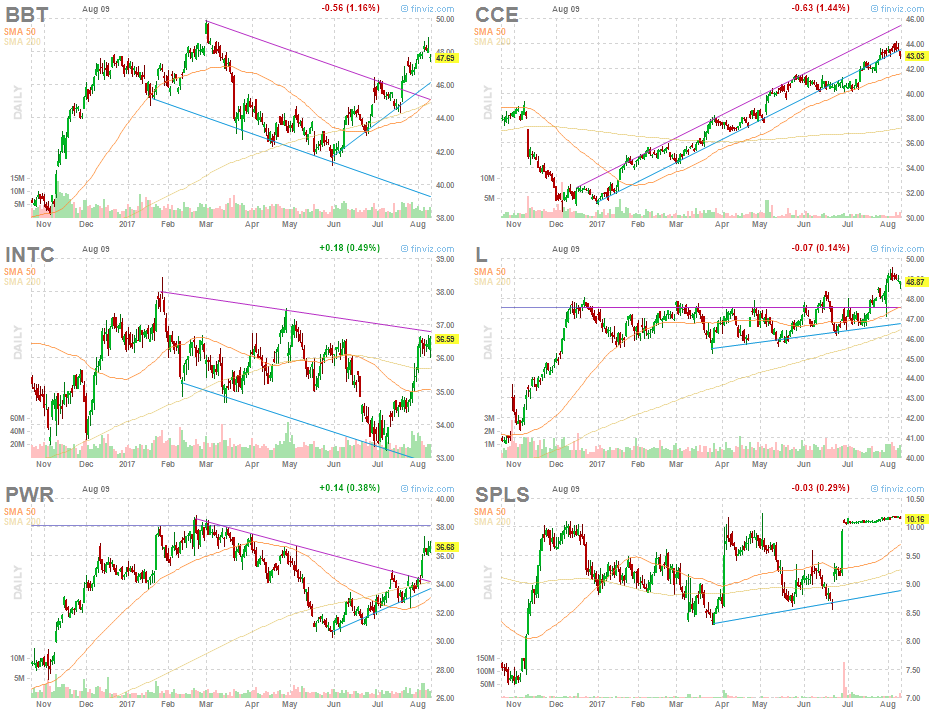
Today’s Screen
Running the stock screen on the market today (10th August 2017) we get the following six tickers that meet the criteria. Could these be good stocks to pick up on the next open?
Amibroker Code
If you would like the Ambroker code to this system, please sign up for the mailing list here. You will be able to download it free of charge.
What’s Your Favourite Stock Screen?
I’m wondering, do you have a favourite stock screen to filter stocks?
Let me know in the comments and I will try and do a backtest.
Agree totally about Finviz – it’s second to none. Especially useful around reporting time to get a bit of heads up on what to expect. Very good for checking up on entering (and holding on) to long term trades.
Never occurred to me to use the screener for backtesting. Good one!
Absolutely, Finviz is great for keeping an eye on upcoming earnings and insider buys as well. Such a great resource!
Very nice articles, I am learning slowly and your post are very useful , informative and simple to understand.
Thank you.
Thanks Kam, glad its useful.
Great post JB! Thanks for sharing. It’s always interesting to see how a simple system can actually work pretty well!
I like to use a few fundamental criteria as well, but do find them tough to backtest for.
Thanks again!
Great Jay, what fundamentals do you like to look at?
I am very new to Amibroker. Tough start. But your website is very helpful to Ami rookie like me.
Hang in there mate. It is tough at the beginning that’s for sure but it’s worth it
Hello, did you have the portfolio equity results from the Finviz screen you backtested? I didn’t understand if the backtest and “out of sample” results were both from the Finviz filter you shared.
Thanks for sharing your hard work!
I’m not sure what you mean. The in-sample and out-of-sample results both use the same ‘finviz’ rules. Does that answer your question?
Yes, it does! So this filter would be best for long-term holds? It showed your progress was from 2002-2012
Hi there, thank you for sharing this intersting system idea.
Just one question regarding the trailing stop and the Micron example:
I guess the trailing stop is defined as something like “high price of the trade” * 0.8.
Is the exit signal on the Micron chart correct then? By visual inspection it seems to me the trade exit was to early, meaning before a 20% drop from the high was triggered. Or do I have a misunderstanding of the trailing stop?
Hi. Sorry, the exit in Micron is actually because the backtest finished on 1 July 2017. The trailing stop wasn’t hit. Not the best example, will change it. Thanks
Really like your post. If you get time can you please check these stocks.
1. UK Oil gas investment PLC (UKOG)
2.Empyrean Energy PLC
3.Wolf Minerals Ltd
4.Sacgas Company limited
5.Amur Minerals corp
Many thanks in advance.
Best regards
kam
He can’t. You can. He does backtests of systems and doesn’t “check stocks”.
Ok, really sorry my mistake, I thought he can check those stock with the same screen and backtest them.
Sorry, I’m not familiar with those stocks.
Hi!
Thanks for sharing this. How did you integrate Finviz with Amibroker? Did you scan for daily stocks in Finviz export the stocks fo Amibroker for each traded day? Many thanks.
Omeros
No I just coded the technical rules into Amibroker and ran a backtest on S&P 500 stocks.
Thanks
Hi Joe,
why did you use Amibroker for backtesting ?
Is it not possible to backtest a Finviz Screen with the Finviz Backtester ?
Regards
Harald Kempf
No, the Finviz backtester is far too limited for any serious backtesting. Amibroker provides many more features.
Hello, I needed to amibroker backtest my finviz strategy. Please let me know how to send it.
Sorry we don’t offer custom programming at this time.