Several months ago I was thinking about candlestick charts and whether or not these classic patterns had any predictive ability for trading. I had a look around but all I could find were vague speculations and cliches. I couldn’t find any solid evidence of whether they actually worked or not.
So… I thought I would casually test out a few candlestick price patterns and see if any of them actually worked.
Shouldn’t be too difficult, right?
This time, I looked around for formulas that I could easily adapt and run tests on. But again, I mostly came up short.
Then, I came across some basic Amibroker code and used that as the base for coding my own candlestick formulas.
I spent some time reading the major candlestick books and began the process of coding my own candlestick formulas as closely as possible to the rules mentioned by writers such as Steve Nison.
I then began testing the patterns on various different securities to see if any of them were any good.
Fast-forward a few months and I have now completed my analysis of 26 different candlestick patterns and I’ve put my findings altogether in a new course called Candlestick Analysis For Professional Traders.
Objective Price Action Analysis
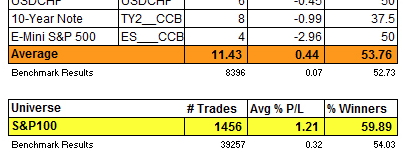
To summarise: I’ve tested every candlestick pattern on 21 different futures and forex markets, across more than 100 stocks and I’ve come to some striking conclusions.
First of all, a number of the most popular candlestick patterns show no profitable expectancy at all. (I’m looking at you gravestone doji).
Second, some patterns are so rare that they almost never occur on daily timeframes.
Third, there are some key differences between the performance of candlestick patterns on stocks and their performance on futures and forex markets.
OK, I suppose none of this is all that surprising so far.
But what is surprising is that there was one, very simple candlestick pattern that significantly outperformed all the others and generated consistent profits over every one of my tests.
What’s more, most traders are actually trading this pattern the wrong way!
What’s also surprising, is that when you combine the candlestick patterns with various indicators and settings you can achieve some even more powerful results. (With the Amibroker formulas I’ve created you can do that very easily).
To round up, I think you will find a lot of value from this new course on candlesticks. Here’s what you’re going to get:
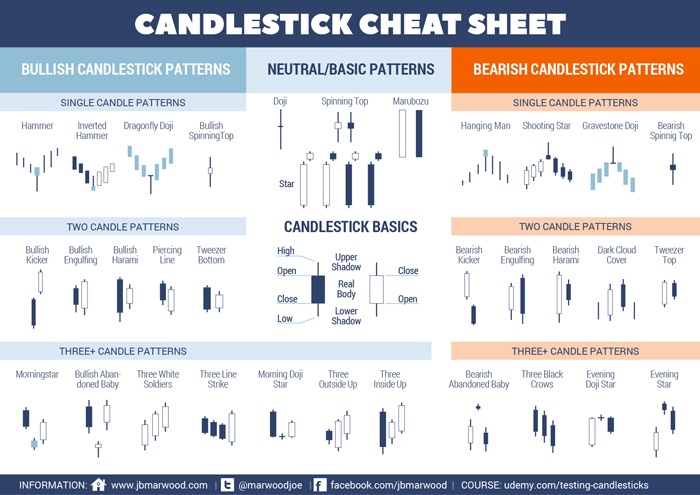
– A basic introduction to candlesticks (well there has to be doesn’t there)
– Historical performance for 26 candlestick patterns (across futures, forex and stocks)
– Clear evidence that shows which patterns work and which don’t (it’s not what you’d expect)
– Interesting results from combining different indicators (very interesting)
– A complete candlestick trading system (modelled in Amibroker)
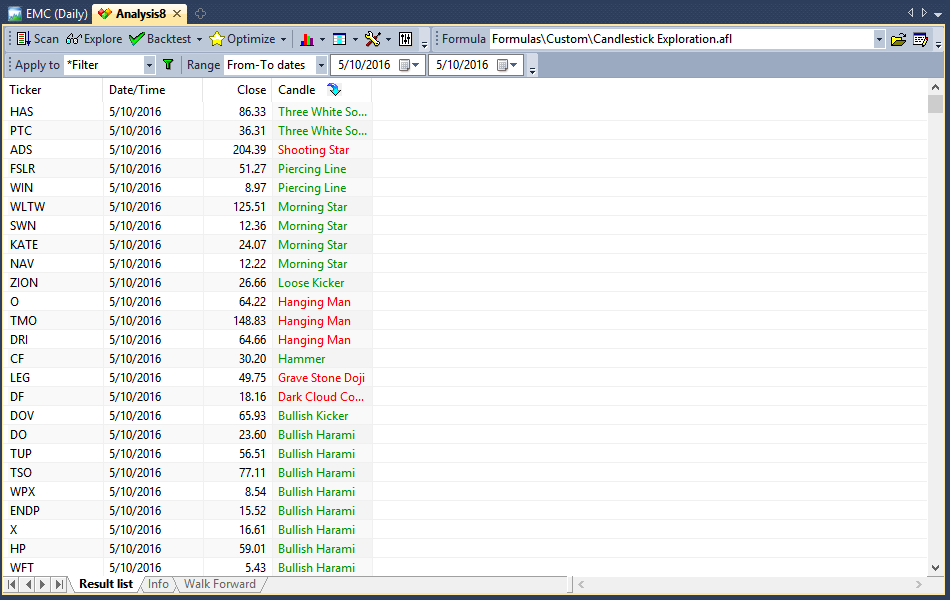
– Amibroker formulas for the patterns so you can quickly scan for signals (exploration)
– Hi-res poster for quick and easy candlestick spotting (stick it on your wall)