Filling the gap is a popular strategy where you buy a stock when it gaps down in the morning and then wait for it to fill the gap. Many bloggers have written about how good this strategy is. However, there usually isn’t much evidence to support those claims.
In this post I test the strategy on 20 Nasdaq stocks between 2008-2018. I find mixed results after transaction costs.
An important caveat for systematic traders. The type of data used for backtesting (whether it is end-of-day or intraday) drastically impacts backtest findings.
Gaps – What Are They And Why Do They Happen?
US stock markets open each day with an auction method. Pre-market buy and sell orders are matched by designated market makers (DMMs) and special liquidity providers. This is intended to improve liquidity and make the opening of the market as orderly as possible.
Sometimes, depending on news flow or market events, there is significantly more buying or selling volume. Therefore, when a stock opens on a gap up or a gap down it shows an imbalance between buyers and sellers.
When a stock opens on a significant gap down, there is an imbalance caused by too many sellers. It can therefore be a good opportunity to buy the stock and wait for the gap to fill.
Back-Testing A ‘Fill The Gap’ Strategy
Gap strategies can be backtested with end-of-day (EOD) data but there are some problems with this approach which I have talked about previously.
To illustrate this problem, I am going to test the fill the gap strategy on two sets of data. First I will test on end of day data from Norgate Premium and then on 1-minute intraday data from DTN IQFeed.
Because we are using different data sets we will need slightly different rules but the core of the strategy will be the same. The rules are as follows:
For EOD data:
- Buy on open when the open is >1% lower than yesterday’s low
- Sell if high is at least $0.05 above yesterday’s low (gap is filled)
- If the gap doesn’t fill sell at market close
For 1-minute data:
- If the stock opens >1% lower than yesterday’s low, buy on open of the next 1-min bar (at 09:31)
- If the stock closes above yesterday’s low, sell on the open of the next 1-min bar
- If the gap doesn’t fill, sell on the second to last bar (at 15:59)
Example Trade Setup
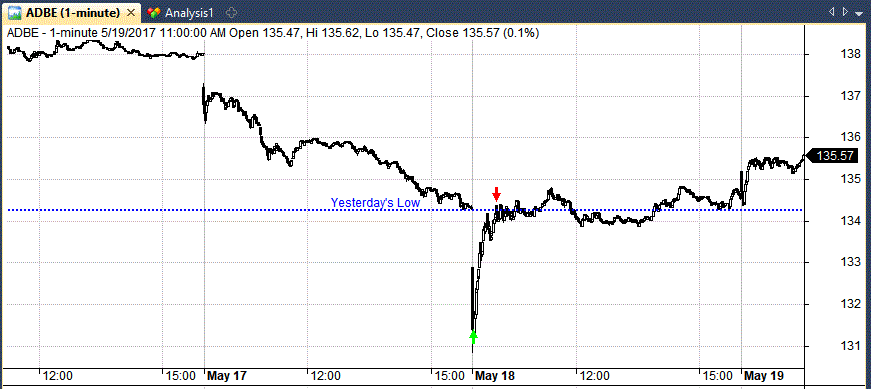
The following chart shows the kind of gap fill trade we are looking for with this strategy. You can see that ADBE opens >1% below the previous day low on May 18th. We therefore go long on the next 1-minute bar.
We then close the trade (about half an hour later) when price moves back above yesterday’s low, filling the gap:
Why Compare Backtest Results?
There are two reasons why I want to compare the results from intraday data vs end-of-day data.
The first reason relates to the structure of US stock exchanges. US stock markets are fragmented which means there isn’t one single exchange. There are several all located in different locations. For example, NYSE, ARCA, BATS etc.
Because the data is compiled from different exchanges it is hard to know which trades get executed on which exchange. That makes it tricky to use limit orders on EOD data. Stock market orders get routed to different places and EOD data doesn’t give us much detail. That means if we use EOD data we will need to use some heavy slippage.
For this reason I have used a slippage of +$0.05 for all sell trades on the EOD test. In other words, it is not enough that the price touches our limit order, price must trade at least $0.05 above the limit price.
The second, bigger, issue is that we are entering right on the open price. This isn’t really possible since the market open price is determined by the opening auction. We are making a mistake if we assume we can find a down gap and then trade right on the open price. We would need to send our orders to the opening auction 10 minutes before the market opens and we would not know if the market will open on a down gap.
The one exception to this would be if we were able to predict a gap down based on pre-market prices and manage to enter into the auction itself. This is not guaranteed. A similar issue exists for exiting on the close price.
However, using EOD data is still useful because it can provide some insight into the strategy and we can test it on a large number of stocks.
But I hope you can see there are difficulties associated with backtesting gaps on EOD data. Using 1-minute data should give us more realistic results so it will be interesting to compare the two.
Filling The Gap Backtest Results
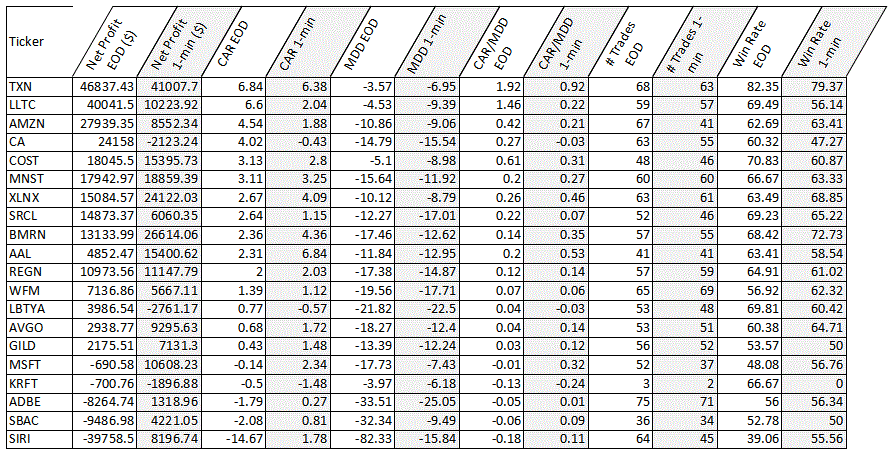
I ran a backtest on a watchlist of 20 randomly selected Nasdaq stocks between 1/2008 – 1/2018 using a starting balance of $50k and transaction costs of $0.01 per share. In the next table you can see a summary of the results on EOD data and on 1-minute data.
The white columns show the backtest metrics for EOD data while the grey columns show 1-min results.
(If it is too small, click into the image to expand it).
Organized by ticker and sorted by net profit, you can see that TXN was our best performer with a total net profit over $40,000 on both sets of data (an annualized return over 6%):
You can see from the table that we have had some good and some bad results. We also have some sharp differences between the two data sets.
For example, the fill the gap stocks strategy worked well for TXN across both sets of data and we recorded a very good CAR/MDD on both tests and an excellent win rate (around 80%).
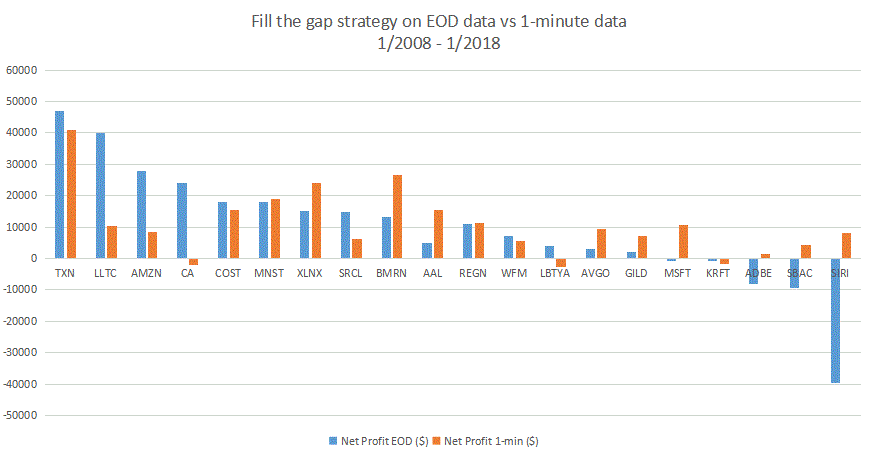
However, CA was a different story. It showed a net loss on 1-minute data but a net profit on EOD data. Similarly, SIRI showed a huge loss with EOD data but a profit with 1-minute data.
Obviously, this is not the kind of thing an EOD system trader likes to see when preparing a strategy for live trading. The differences in results are likely to show up in poor performance when the system is taken live.
The following chart shows more clearly the differences between the two datasets:
What To Make Of These Results?
I believe we can make at least a couple of conclusions from this analysis.
The first is that there are clear differences in the results produced by end-of-day data vs 1-minute data.
When backtesting on 1-minute bars, more issues were net profitable. This is quite a positive result because the 1-minute data should be more trustworthy than the EOD data.
The second conclusion is that the gap fill strategy does not appear to be a particularly outstanding strategy when applied to this selection of Nasdaq stocks.
Across our 20 fill the gap stocks the average annualized return (1-minute data) was only 2% and the average CAR/MDD only 0.20. Intraday trading is not easy.
There are some positive characteristics, however, which means further analysis might be useful. For example, it’s encouraging to see some high win rates and only three tickers (in the 1-minute test) saw losses.
Notes: Charts produced with Amibroker using Data from Norgate and IQFeed.


