I mentioned in a recent article that one of the things I like best about Amibroker is the ability to import data sets from various sources and use it to create indicators.
In this post, I show how to import TED spread data and import it into Amibroker. I then build a simple economic indicator that uses the TED spread for market timing.
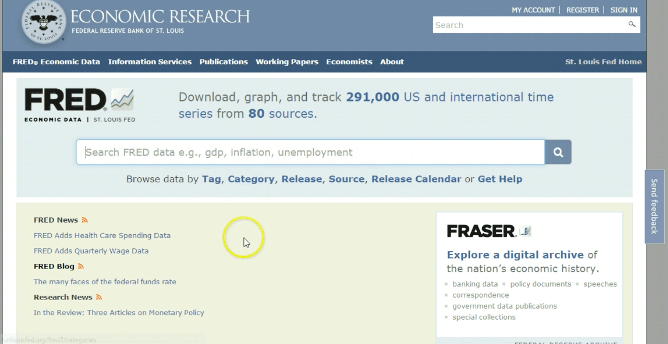
Where to find economic data for Amibroker
There are various sources of economic data on the web and I talk about a couple of places on my free trading tools course.
However, the best place to get US economic data is FRED, which stands for Federal Reserve Economic Data. Here, you can find all sorts of data ranging from unemployment to inflation to GDP. And all of it can be imported straight into Amibroker.
In this article I am going to be using data for the TED spread.
What is the TED spread?
The TED spread is calculated as the spread between the 3-month LIBOR (calculated in dollars) and the 3-month Treasury Bill. So it measures the difference between interest rates on interbank loans and short-term U.S. government debt.
The TED spread therefore reveals confidence in the banking system and as I mention in my book, it can be an excellent leading indicator of fear in the financial markets.
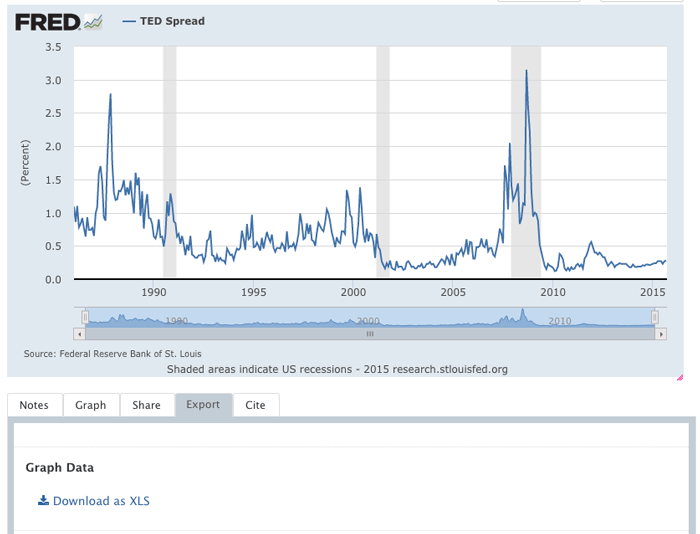
In 2008, for example, many banks grew too afraid to lend money to each other (as a result of toxic assets on each others balance sheets). As a result, the TED spread rocketed to over 3%.
The rapid increase in the TED spread was one of the first indications that the financial system was coming under severe pressure. And the TED also spiked higher during the 1987 crash.
Downloading and cleaning up the data
To get the TED spread into Amibroker we are going to treat it just as we would when importing data for an individual stock. First we have to download the data and clean it up.
So simply export the data as an .XLS file on FRED and then open it up in Excel.
Cleaning up the data
We need to format the data correctly so it can be imported straight into Amibroker.
The first thing to do is delete the first 10 rows as these are only used for description.
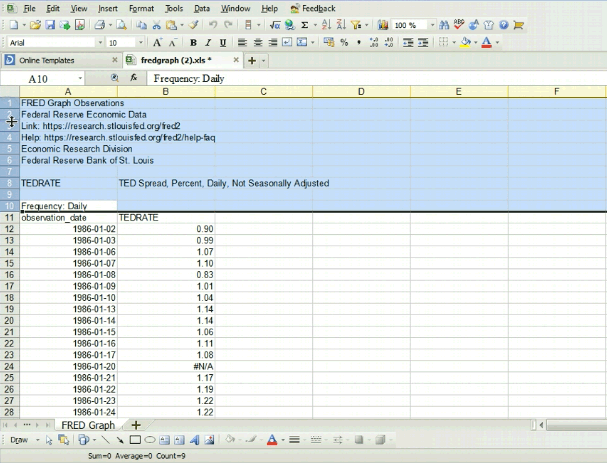
Next, insert a new column, calling it ‘Symbol’ and fill the column with the name $TED.
Next, we need to get rid of any cells that have no data and are showing up as #N/A.
Use the autofilter to select the N/A’s and then change them to some other value such as ‘ABC’.
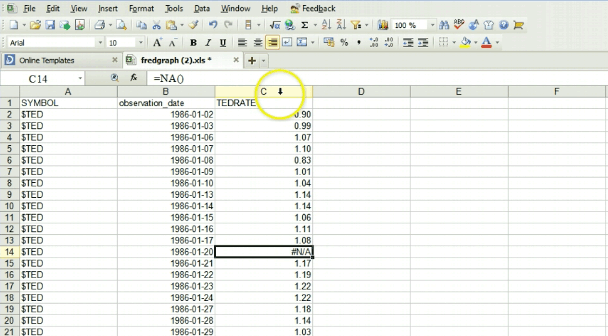
Once that’s done, enter the following IF formula into the adjacent cell on the right.
=IF(C2 = “ABC”,C1,C2)
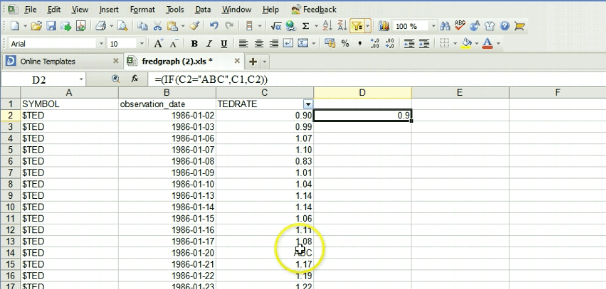
This will find all the cells with ABC in them and replace ‘ABC ‘ with the value in the cell above. This is a simple way to clean up the errors by using the TED spread value from the previous day.
You might need to do this a couple of times in order to get rid of all of the N/A’s.
Nearly there
Once that’s all done, copy and paste over the values in column D into the four columns, calling them open, high, low, close. We are putting the value for the TED spread into the open, high, low and close fields. This will make it easy for us to reference the symbol in Amibroker. The file should like this:
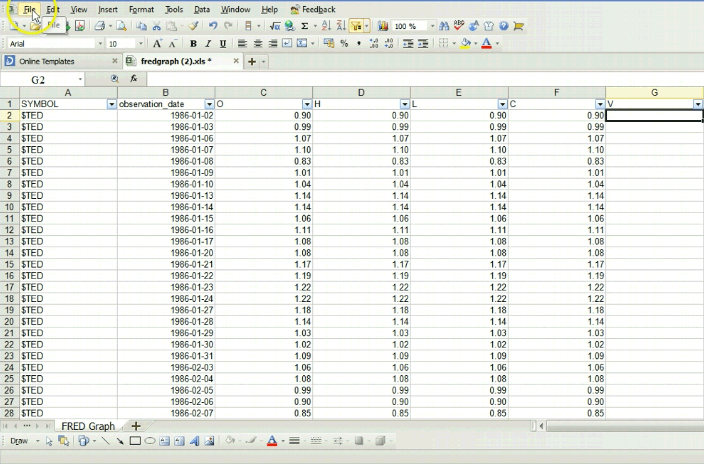
Save the spreadsheet as a .CSV file and close it.
It’s now time to move over to Amibroker and import the data.
Importing into Amibroker
The quickest and easiest way to import the data is to go File/ Import Wizard then pick the CSV file you just created.
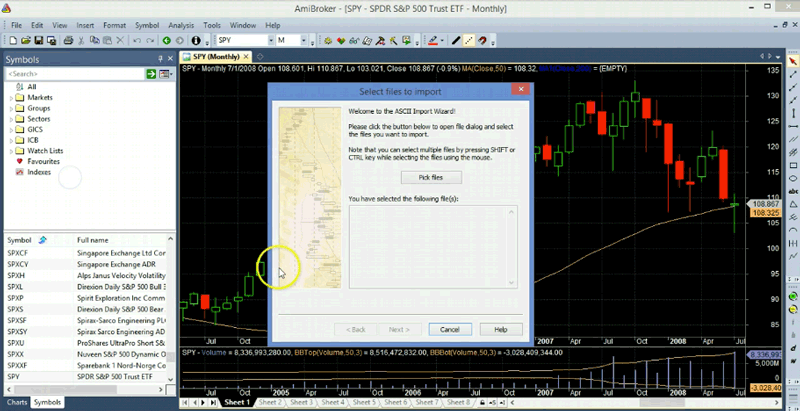
The important part here is to make sure the fields are set up correctly. The ticker symbol is in column one, the date is in column two, and the price fields make up the rest.

(Always make sure that the date format in the spreadsheet matches up with the format used in column 2).
Change ‘skip first’ to 1 lines, since we do not need to import the column titles. Then click ‘Next’, and then ‘Finish’.
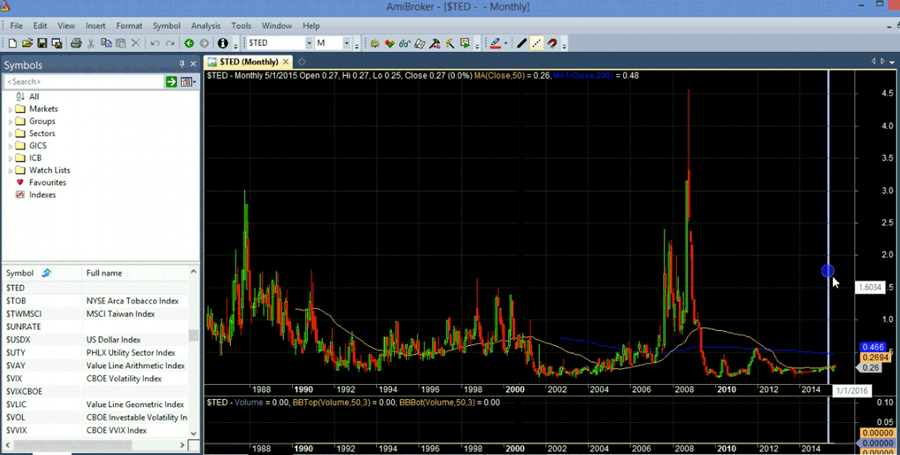
This should put the TED spread into Amibroker as under it’s own symbol.
Locating the new symbol
At this point, Amibroker will usually flash up if there are any problems. If there are no problems, simply move over to the symbol field and type in the symbol you created ($TED) to locate the new symbol.
And voila! That will bring up a chart for the TED spread which you can now reference in your trading systems using the Amibroker Foreign function.
Using the TED spread in a trading system
Now that we have the TED spread loaded into our Amibroker database under the ticker symbol $TED, we can use it any number of creative ways by referencing the symbol with the ‘Foreign’ function. Like this:
TED = Foreign(“$TED”,”C”);
One important thing to note, however, is that the TED spread is updated on the Federal Reserve website with a delay of one week. (This is mentioned on the website under the ‘notes’ tab).
In order to make the trading system realistic we must therefore reference the TED spread in the past: Like this:
TEDSPREAD = ref(TED,-5);
Test one – Buy & Hold
In this first test, we are going to run a simple buy-and-hold test on the S&P 50o ETF, ticker symbol $SPY. And we are going to use the TED spread as a simple market timing filter.
So, whenever the TED spread is below 0.2 (indicating a calm market) we are going to buy SPY and whenever the TED spread climbs above 0.8 (indicating increasing fear) we are going to exit our trade.
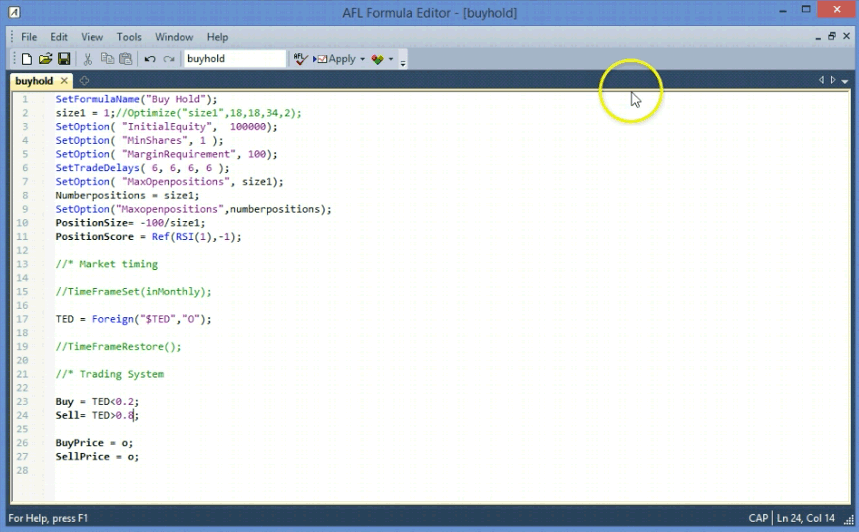
Commissions are set at $0.01 per share and the results are shown below:
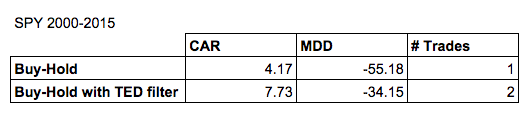
As you can see from the table, the buy-and-hold return without the TED rule was 4.17% with a maximum drawdown of 55%. When we introduce the TED spread market timing rule, the annual return increases to 7.73% and the maximum drawdown falls to 34%. In other words, the TED spread indicator helped us avoid the bear market of 2008.
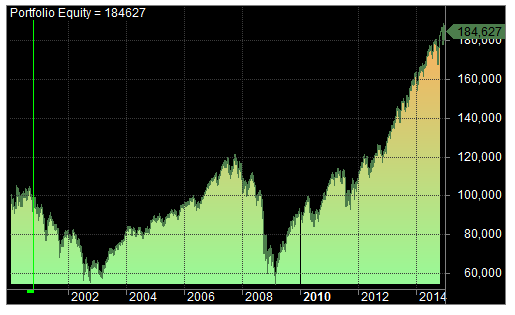
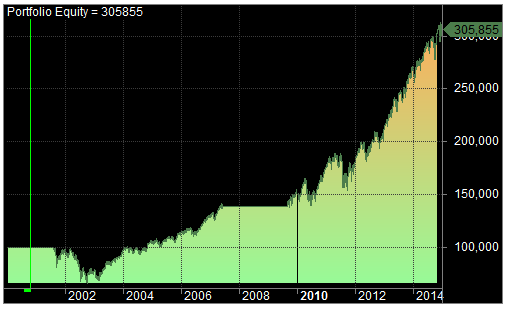
Following are the equity curves from the two tests:
Conclusions
It is shown in this article that incorporating economic data into a trading system might have some use for developing trading systems. A timing rule based on the TED spread was shown to improve a simple buy-and-hold strategy based on risk and return.
This does not mean to say that the TED spread will always work. It is perfectly conceivable that the next stock market crash could happen without a significant jump in the TED. However, the purpose of this article was to show you how to incorporate economic data and the results suggest that there is some use in doing so.
– Click here to download the TED spread CSV file that can be imported straight into Amibroker.
Credits
SPY data from Premium Data. Equity charts from Amibroker.
You may also like:
– Market timing with the VIX Index
– 10 reasons not to believe in efficient markets
– 30+ trading strategies for stocks