In this article I look at some moving average crossover strategies and I investigate which moving average crossover lengths are the most effective.

The moving average is one of the most widely used technical indicators available to traders and the moving average crossover is one of the most popular strategies. By taking an average of the recent price action, moving averages smooth out prices so traders can filter out the random noise and concentrate on the true direction of the security. This enables traders to clearly define trends and make more confident buy and sell decisions.
The two most common types of moving average are the simple moving average (SMA) and the exponential moving average (EMA) though there are now a number of different alternatives available. The simple moving average is calculated over a defined number of time periods and is period is weighted equally, while the exponential moving average gives greater weight to the more recent prices.
The SMA and EMA have been the basis of many successful trend following strategies over the last 40 years and are still commonly used by traders today.
Trend following approach
The moving average is the perfect tool for showing the true price direction of a security, free from noise and random price fluctuation. When a moving average is moving higher the trend is up and when a moving average is moving lower the trend is down.
A common strategy amongst trend followers is to buy a security whenever a fast moving average (such as the 50-day MA) crosses over a slow moving average (such as the 200-day MA). This suggests that the recent trend is up.
Trend followers then sell, or go short, when the fast moving average crosses back under the slow moving average, indicating that the trend has now changed.

Mean reversion approach
Although moving average crossover strategies are most commonly associated with trend followers they can been used by mean reversion traders too. In this instance, a moving average crossover may indicate that a market has strayed too far away from its mean and is due for a rebound. A mean reversion trader will therefore trade in the opposite direction of a trend follower when a crossover takes place.
Due to the proliferation of traders who take the trend following approach, there is use in testing the mean reversion version as well.
Testing different moving average crossovers
In a recent podcast interview, one of the original Turtle Traders, Jerry Parker, suggested that trend following has become more difficult and that short-term moving averages no longer work as well as they once did.
This is something I have found myself. As financial markets become more efficient, short-term, high capacity trading systems no longer work as well.
In the rest of this article I will build a simple portfolio strategy for stocks and test different moving average lengths in order to find which crossover strategies work the best. Although the results are historical, they should provide us with some clues for trading in the future.
Setting up the test
In order to test different moving average crossover strategies I’m going to load up Amibroker and create a simple portfolio strategy that holds a maximum of 10 stocks.
Whenever a moving average crossover occurs the stock is bought and added to the portfolio. When the two moving averages cross paths again, the stock is sold and it drops off the portfolio.
Different moving average lengths will be tested to find out which crossover works best.
Universe and settings
Tests will be run on the S&P 500 universe of stocks between 1/1/2000 and 1/1/2015 and commissions will be set at $0.01 per share. Stocks will be weighted equally and ranked according to RSI(14). The test will be long only so no short positions will be allowed.
The objective function used will be the CAR/MDD ratio which is the compounded annual return divided by the maximum system drawdown (peak to trough in equity). This will enable us to compare results and identify which crossover lengths works the best. The higher the CAR/MDD ratio, the smoother the equity curve and the better the system.
Test one – golden cross
For this first test, the system buys a stock whenever its 50-day moving average crosses over its 200 day moving average (also known as a golden cross). The stock is then sold when its 50-day MA crosses under its 200-day MA.
Running this test on the S&P 500 universe of stocks between 1/1/2000 and 1/1/2015 with a maximum portfolio size of 10 stocks returns the following results and equity curve:
![]()
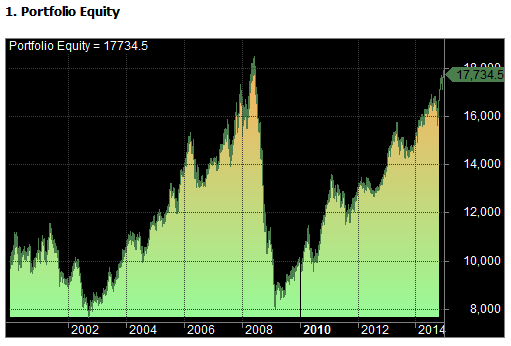
The compounded annual return was only 3.89% with a maximum drawdown of -57%, giving a CAR/MDD ratio of 0.07.
Creating an optimisation in Amibroker
We have now tested the golden cross strategy and the results were less than pleasing.
What we can do now is vary the moving average lengths to see which crossover is optimal and this is extremely easy to do with the Amibroker optimiser, using code as follows:
FastMA = optimize( “FastMA”, 50, 10, 400, 10 );
SlowMA = optimize( “SlowMA”, 200, 25, 450, 25 );
When we include these variables in the buy rules and run the optimiser, Amibroker is going to test every possible combination of the two variables.
Optimisation results: which crossover is the best?
After running the optimisation, Amibroker presents a list of results for each combination.
We can now click into the ‘optimize’ button again in Amibroker and choose view 3d optimisation graph and get a 3D visualisation of the results, as shown below:

We can also export the results to Excel or to a data visualisation program like Tableau.
How to read the results
The following table shows the results of the optimisation based on the CAR/MDD ratio where the x-axis shows the length of the slow moving average and the y-axis shows the length of the fast moving average (in days).
By moving across the table you can find the system result for each crossover. For example, the 50/200 day moving average crossover resulted in a CAR/MDD of 0.08 and is shaded light green.
Darker shades of green represent better results, as measured by CAR/MDD. The optimal result comes when the fast moving average is 340 days and the slow moving average is 350 days. This gives a CAR/MDD ratio of 0.60.
The next table is the same but instead of showing CAR/MDD, it shows just CAR (%):
Looking at the results
Looking at these results, we can see some clear patterns have emerged.
Best performance, represented by the darker shades of green, is mostly located towards the longer term moving averages, which confirms our initial hypothesis that short-term moving averages are less effective.
Interestingly, it appears that the length of the slow moving average is more important than the length of the fast moving average. For the slow moving average, values over 200 days should be preferred. Some good values appear to be 100-150 / 275-350.
You can also see a handful of good results (in the top left corner) where the fast moving average is longer than the slow moving average. This is the mean reversion approach in action.
Rounding up
Clearly, there are more avenues we could go down in order to test moving average crossover strategies.
We could test different types of MAs (such as the EMA, TEMA, WMA), different portfolio sizes, different markets and more combinations.
Overall, the results confirm our suspicion that longer term moving average crossovers are more effective when trading US stocks.
You may also like:
– Full List Of Trading Systems
– Using RSI In Stocks
– Stock Market Timing Strategy: MA crossover
Trading systems created in Amibroker using survivorship-bias free data from Norgate Premium Data. Click here for a free trial.