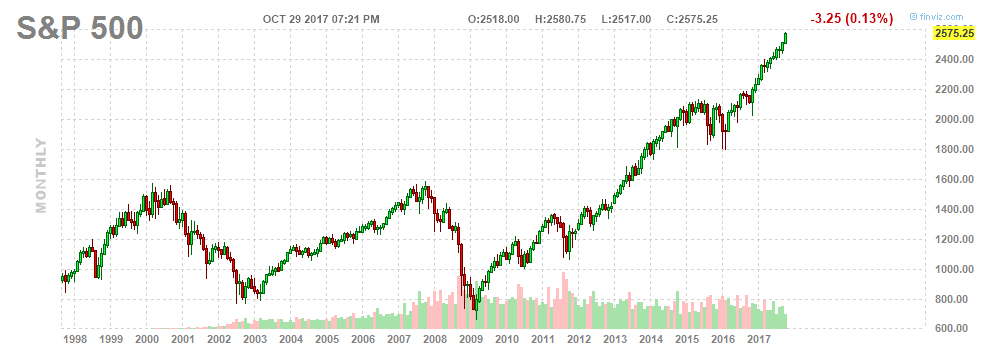
One of the hardest things to do in investing is to buy the market as it makes yet another new high.
Intuitively it makes little sense. The only way to profit in the stock market is to sell something for more than you paid for it so why would you buy something that has been going up for the last eight years?
You might be able to buy on the first breakout or the second. You might be able to buy on a slight pullback from a new high.
But almost everyone who watches the market has trouble pulling the trigger when it has been roaring relentlessly upwards for months or years at a time.

Regression To The Mean
The good news is that this fear of buying the market at new highs is not entirely unfounded. The concept of regression to the mean teaches us that things usually revert back to their averages given enough time.
In the context of the stock market, that means overall returns should at some point revert towards their long-term averages of 6-7% per year.
It means that sometime in the future there will be another correction – of at least 20% – just like there has been throughout history.
But despite this, many ordinary investors continue to feel the inevitable short-term pain of missing out on moves that they are too afraid to partake in.
Most Investors Will Underperform
The facts suggest that even though we are in a raging bull market, most ordinary investors will drastically underperform and some will even lose money.
There are so many factors at play to explain this, many of which I have discussed in the past.
The fear of missing out causes investors to stress when they miss out on easy trading profits.
As the market breaks to new highs they forget about long-term averages and feel regret that they did not invest more and earlier.
Alongside this, recency bias causes investors to over-emphasise either memorable events or the recent past.
You know that stocks are going up recently and you feel you should be part of it.
And yet you also remember the global meltdown of 2008 and fear that another crisis could happen at any time.
You will likely also suffer from hindsight bias and the problem of aversion to losses.
All of this simply adds to your cognitive dissonance and causes further confusion and stress. None of which makes for optimal investing conditions.
As a result, it is no wonder that the average investor will miss out on a big chunk of market returns.
Unless you take a disciplined and mechanical approach to investing you will inevitably underperform.
What Keeps The Market Up?
Since investors generally find it hard to invest at all-time highs there is a question as to how the market can keep on going up if no-one is buying.
One answer is that, just like many investors are too scared to buy, they are even more scared to sell. It takes great courage to go against the crowd.
A bigger part of the answer, of course, is algorithmic traders.
Trading algorithms, for the most part, do not care whether a market is at another record high or how long in the tooth a bull market is.
They simply follow a set of rules based on an edge or based on the concept of following a trend.
They execute trades efficiently and without emotion and do not suffer from human flaws.
Sweaty Palms
When you open your brokerage account and click the button to buy the S&P 500 your heart rate increases.
Your palms may even get a little bit sweaty and, depending on the circumstances, you may suffer from all sorts of emotions.
But a trading system suffers from none of that. It simply follows it’s rules based on statistics and hard evidence.
Crucially, it doesn’t have to be complex.
Investing mechanically in the index each month or following a simple rules-based strategy has been proven to work far better for the majority of people than any other approach to market timing.
And don’t forget, the S&P 500 is just a trading system in it’s own right with it’s own set of rules.
Free Trading System
Earlier this year, I gave away the rules to a simple trend following system for stocks.
It’s just a simple investing system like described above that benefits from being mechanical and disciplined.
The system has returned an average of 12% over the years and 15% so far in 2017 with a win rate of 67% and a maximum drawdown of just -3.17%.
That is actually a similar return profile to the S&P 500 this year. The idea is that when the next correction does occur, the system will have a better chance to switch off and reduce drawdown.

Hi, JB,
I am a reader of your blog. My question are a little bit off the topic here but I cannot find better place to put it.
I noted some of the free stock chart does provide back-adjustment on corporate actions, however, they do not adjust cash didivends. Therefore, we will have a down gap at the Ex-Div day. If we use the data provider that can creat our own charting, do you back adjust cash dividend as well or just leave it there? I hope you could share your insight on this. Thank you very much.
Sam
Hi Sam
Yes, the data provider I use adjusts the price for cash dividends. This gives a more accurate chart. The option can actually be turned on/off for different needs.
Thanks