Last Friday the S&P 500 formed a shooting star candlestick pattern on the daily chart. This is a Japanese candlestick formation that is normally a bearish reversal signal. Sure enough, the S&P 500 moved lower the next day, dropping around 15 points. We saw this happen last September too. But how often does this bearish pattern really play out?
What Is The Shooting Star Candlestick Pattern?
The shooting star pattern occurs when a security opens strongly, moves higher, but then falls back and ends up closing near or lower than the opening price.
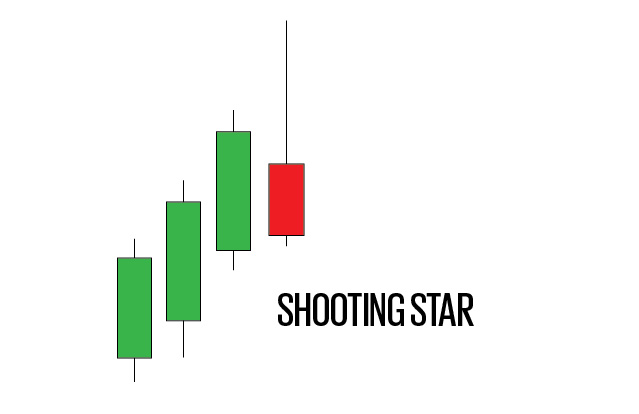
The candle should have a long upper shadow, close near it’s lows and it should occur in an uptrend.
So, the shooting star is a signal that buyers have bought the market up but they’ve then been overpowered by sellers. When this occurs in an uptrend it’s a signal that momentum is waning and a reversal could be about to begin. Thus, when a shooting star occurs it’s a signal to sell the market or go short.
Shooting Star Rules
In order to classify the candle more precisely, we will come up with some rules and say that the candle length must be more than twice the size of the real body and the upper shadow should be more than 3/4 of the candle length.
There should also be very little lower shadow and the pattern should appear in an up-trend.
One of the pioneers of candlestick trading, Steve Nison, is not clear exactly what an up-trend should be, so we will define an up-trend as when the high of the candle is the highest high in 10 days.
Thus, the shooting star candlestick pattern can be written in code as follows:
Uptrend = H > Ref(HHV(H,10),-1);
ShootingStar = (((H-L)>2*(O-C)) AND ((H-C)/(H-L)>= 0.75) AND ((H-O)/(H-L)>= 0.75)) AND Uptrend;
In this instance, H-L represents the length of the candle and O-C represents the body.
Testing The Shooting Star Candlestick Pattern
As mentioned above, the S&P 500 formed a bearish shooting star pattern last Friday and the very next day the index proceeded to fall around 15 points. So far so good. But how profitable is this pattern on a longer term horizon?
Since we now have the candlestick pattern written down in code we can easily test the rule on historical stock market data and see if this is a profitable pattern.
Test One – Short S&P 500 (SPX)
In the following test, I informed my back-testing platform Amibroker to short the S&P 500 Index ($SPX) whenever a shooting star candlestick pattern occurs on the daily chart. The system shorts the market on the close of the shooting star and exits on the very next close. In other words, a 1-day holding period.
Without commissions, the following results are recorded between 1/1/2000 and 1/1/2016:
Number of trades: 23
Average profit/loss % per trade: 0.25%
% Winners: 47.83%
You can see that shorting the S&P 500 Index after a shooting star and closing the trade after one day has been a fairly rare but positive trade over the last 16 years. The shooting star pattern (as we defined) occurred 23 times during the period and made an average of 0.25% per trade.
Thus, when a shooting star pattern occurs, the S&P 500 does usually drop the next day and if you had traded this pattern, you would have been right on average. (This is before any form of money management has been applied.)
Clearly, this is only a small edge and whether or not it is truly profitable will come down to your cost structure and how tight your spreads/commissions are.
If we run the test again but this time we assume a 0.03% commission per trade we get the following results:
Number of trades: 23
Average profit/loss % per trade: 0.19%
% Winners: 47.83%
So, this strategy does show some promise.
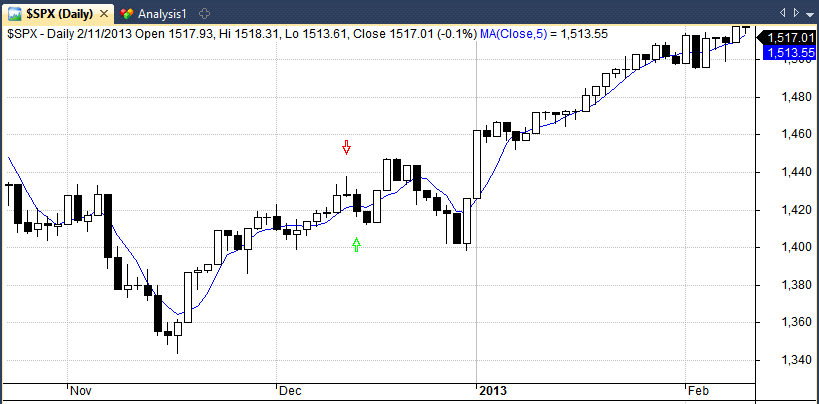
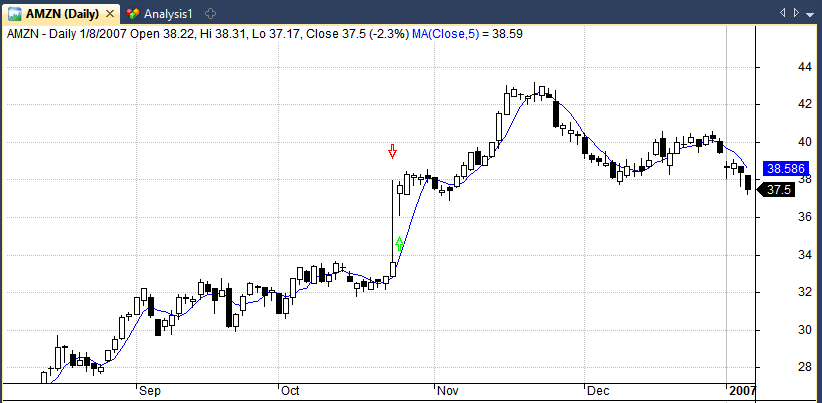
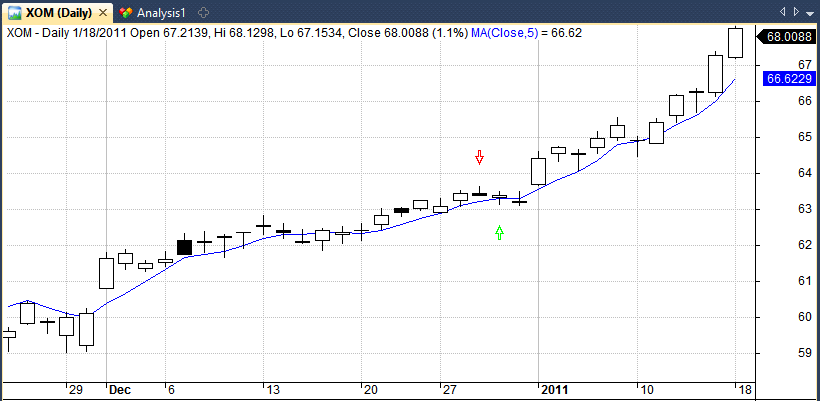
Shown below is an example of a winning trade from 2012 on SPX. The red arrow is our short signal which was executed on the close and the green arrow is our signal to cover the trade on the next close:
Test Two – Different Holding Periods & Different Markets
We have seen how the shooting star pattern performs on the S&P 500 Index with a one-day holding period and we have reported a very slight edge.
In the next test, I informed Amibroker to run the same system but this time using various holding periods and on a range of different markets, including stocks, currencies and commodities.
The results (before commissions) are shown in the following tables:
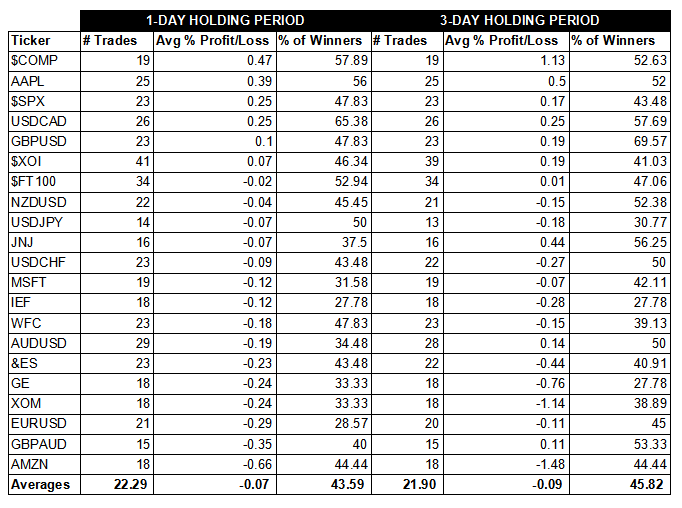
As you can see from these results, shorting the shooting star pattern with a one-day holding period was only profitable for six out of 21 markets: COMP, AAPL, SPX, USDCAD, GBPUSD and XOI. The Nasdaq Composite Index reported an average profit of 0.47% per trade while Amazon reported an average loss of -0.66% per trade.
Worryingly, the signal was not profitable for the E-Mini S&P 500 future even though it was profitable for the SPX future. This is conflicting evidence and suggests that additional steps may need to be taken to verify the results.
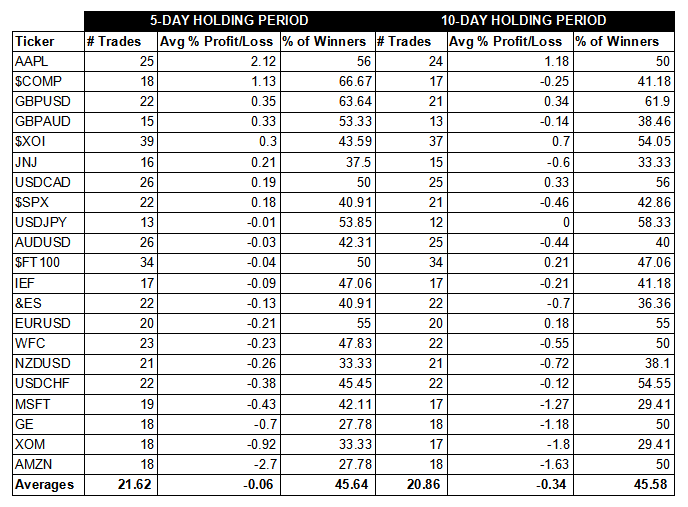
Looking at a three-day holding period, the results are a little more promising and about half of the markets we looked at produced profitable results. After five and ten days, however, returns appear to tail off. (You would expect this for the equity assets as they have an upward bias).
Shown below is a losing example of a short trade on Amazon:
Conclusion and Drawbacks
Although we found some evidence that shorting the S&P 500 Index after a shooting star candlestick pattern has been a profitable signal over time, overall, the results are not particularly supportive of this particular pattern.
When viewed across a range of different markets the signal lost money and even though there were times when it did spot short-term reversals, you would not want to place too much confidence in this pattern on it’s own. This suggests that I may need to re-think my use of the shooting star in intraday trading.
However, there should also be some mention of the potential drawbacks with this test.
Firstly, using mathematical formulas does not always enable us to find the most promising patterns. Sometimes Amibroker found shooting stars that in reality, you would not have wanted to trade in real life. This one for example:
This raises the argument that the human eye is more capable of identifying profitable patterns than a computer and there must be some truth attached. In reality, a trader could add many more factors into the mix and that may turn the shooting star into a more worthy pattern to look out for.
As such, next steps may involve combining this pattern with other indicators such as volume, moving averages or fundamental data. Another option might be to abandon this pattern for now and take a look at some other formations – something that I intend to do over the coming few weeks.
Tests in this article created with Amibroker using historical data from Norgate Premium Data, get a free trial here.
Mr. Marwood,
Sincere thanks for the effort and time you put in making available such useful and concise research. I am completely overwhelmed by the knowledge base that you have made available to retail traders like me. I came to know about your website through one of Mr. Dave McLachlan’s videos; many thanks to him as well.
Keep up the good work Sir.
Thanks and Regards,
Neha
You’re welcome Neha. Glad it’s making a difference.
Very nice Joe. You’ve taken candlestick usage to a new level.
They increase trading probabilities tremendously. I found variations with qualitative values that for each formatooms that skewed the screening results. I think you hit on a solid back testing process. statistical sample over of when and how often they occur — given economic trends (macro level) vice shifrs in fundamentals (micro level) is something I’ve been researching. I’d like to hear more!!
Thanks Rob, I am also a big fan of candlesticks. I feel there is no better way to quickly gauge price action than to watch candlestick charts and I will be doing more studies like this over the next few weeks. It is all part of the traders toolbox. Thanks for your input.
Hi Joe,
You wrote,
“In order to classify the candle more precisely, we will come up with some rules and say that the candle length must be more than twice the size of the real body and the upper shadow should be more than 3/4 of the candle length.”
Isn’t the “3/4 of the candle length” rule is sufficient for the “more than twice the size of the real body ” rule?
Hi Dan, actually yes, you are correct.
Joe
You do great work. Another consideration for future efforts: doji with gap up/down candlestick and bullish/bearish engulfing signal. I find that coding is the key to determine identification. I’ve detected many bullish signals during distribution phases and during moderate volatility timeframes. The candle body was subject to some rational OC to HL conditions. Also during distribution phases when channel breakouts. Additional detection when institutional or smart money was within the 60 to 70 volume spikes. My observations are empirical at the moment. further testing to quantify over various timeframes. one step at a time. Anyway, I hope your success help others.
Thanks for the ideas. I plan to test the engulfing patterns and several more besides. I like the idea of the gap up/down as that is easy to code in Amibroker. I also just tested the signal again but this time the market had to be in a downtrend (defined in this case by the 200ma sloping downwards). Unfortunately, there was no significant improvement in results, shown here >> http://imgur.com/CmDCodY
Great article! It would be nice to see updated results with the “false” shooting stars filtered out. Maybe look for those with a higher than usual candle height.
Yes, difficulty is filtering out the false stars without getting rid of the good ones. Human eye is better but we can try.