In a recent article we looked at the shooting star candlestick pattern and we found that it wasn’t a particularly successful signal for spotting reversals. In this article we will look at another bearish reversal signal in the form of the gravestone doji candlestick pattern.
What is a Gravestone Doji?
A doji is a Japanese candlestick that is a signal of indecision. The gravestone doji is a bearish candlestick indicating a downside reversal could be about to take place.
The gravestone doji should appear in an uptrend. It should have a narrow body with a long upper shadow and small or non-existent lower shadow. The longer the upper shadow, the stronger the reversal signal is.
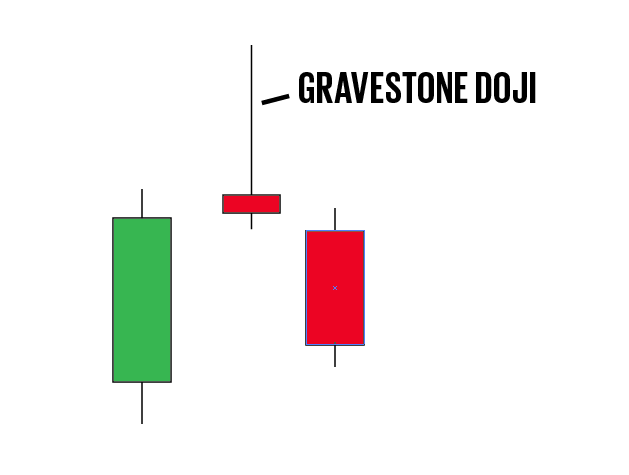
This candle shows that the market has gone to new highs with a fair amount of strength but it’s been brought back down by the sellers and closed right where it started. So this is an indication that the market is losing momentum and therefore could reverse.
And here a classic gravestone doji setup we can see in Alcoa Inc ($AA):
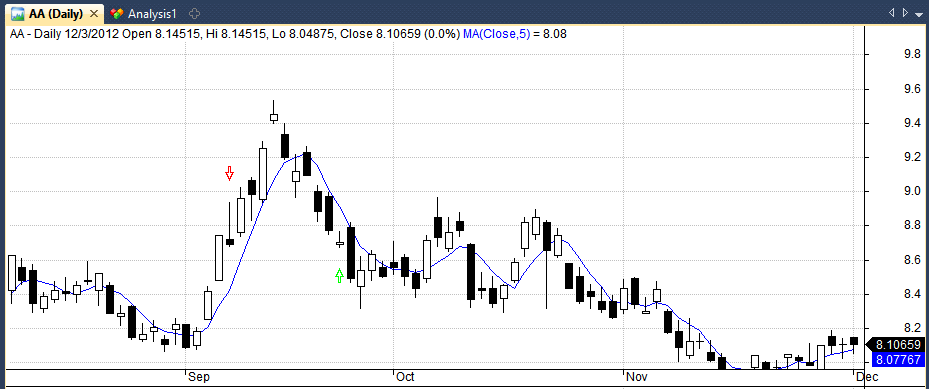
In this example, the gravestone doji (shown by the red arrow) was early but the market did eventually reverse to the downside.
Gravestone Doji Rules
- Bearish candlestick that indicates reversal
- Appears in a uptrend
- Extremely small body
- Long upper shadow
- Very small or no lower shadow
Notes
- Longer the upper shadow, stronger the signal
- Can sometimes be bullish if in a downtrend
Our formula
In order to test the gravestone doji pattern in Amibroker we need to come up with a definition for the pattern and write it into code. In this instance we shall say that the body should be less than 20% of candle length and it should occur near the bottom of the candle. It should also only appear in an uptrend and we will define this by the presence of a new 10-day high.
Here is the gravestone doji written down into Amibroker code:
Uptrend = H > Ref(HHV(H,10).-1);
GravestoneDoji = (abs(O-C))/(H-L) < 0.2 AND C<=(L+((H-L)*0.2)) AND O<=(L+((H-L))*0.2) AND Uptrend;
Testing the Gravestone Doji Candlestick
Using the formula above we can use Amibroker to scan for the gravestone doji and see how the pattern performs as a short signal. Since the gravestone doji is a bearish reversal pattern it should be able to predict downward moves in the market.
To analyse this I decided to run two tests.
The first test is run on a selection of 21 different markets including forex pairs, stocks, and futures between the 1st January 2000 and the 1st January 2016. This test will be run on daily data and we will be analysing the pattern based on a holding period of 1, 3, 5, and 10 days.
The second test will be exactly the same but run only on stocks from the S&P 100 universe.The data for both tests comes from Norgate Premium Data and is survivorship-bias free because it contains delisted securities and is amended for historical actions.
Basically, we are going to run through every security in our two watch-list and whenever a gravestone doji takes place, we’re going to short the market on the close and cover it back after 1, 3, 5 or 10 days. Exits will also take place on the close. This should allow us to see how successful the signal is.
Test Results
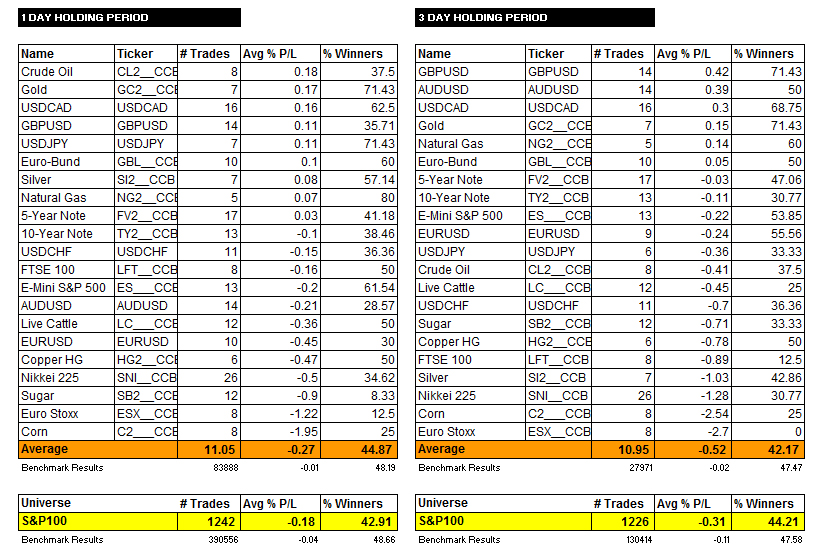
In the first table on the left we can see the results of shorting a gravestone doji pattern on the close and holding the trade for one whole day.
As you can see, the strategy of shorting a gravestone doji and holding for one day produced an average loss of -0.27% in our 21 markets with an average win-rate of 45%. And it produced an average loss of -0.18% in stocks with a win rate of 43%.
With a 3-day holding period (right table), the pattern also did poorly. The pattern produced an average loss of -0.52% in our 21 markets with an average win rate of 42%. In stocks, the strategy did even worse with an average loss of -0.31% and an average win rate of 44%.
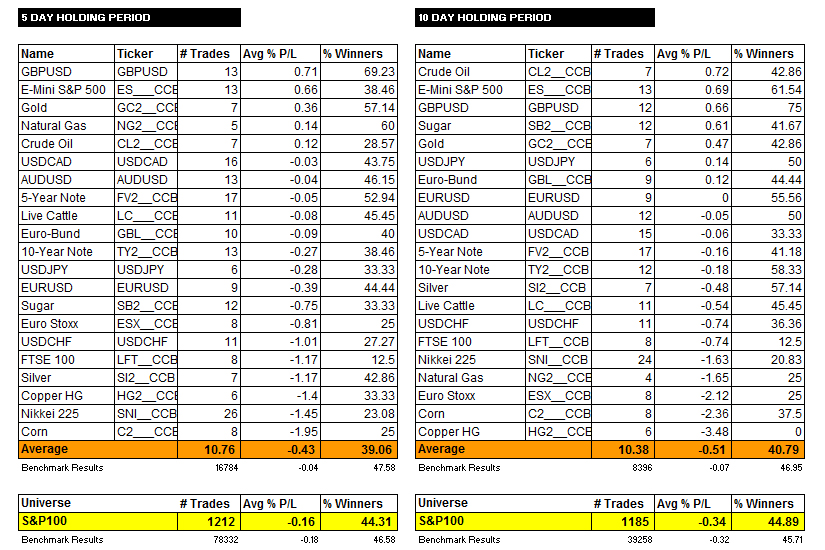
As you can see from the following two tables, the strategy was also negative with a 5-day holding period and 10-day holding period.
Conclusions
Overall, you can see that shorting a gravestone doji pattern is not a profitable pattern to look out for. The strategy has a low win rate and produces negative returns over every holding period tested.
The results suggest that the gravestone doji is not a strong reversal signal. In fact, you would have more success from buying a gravestone doji than shorting one, particularly in stocks. This begs the question as to how many other candlestick patterns are worth bothering with.
It’s fair to say that I have become slightly obsessed with candlesticks over the last couple of weeks and I will most likely put my findings into a new course/eBook so stay tuned for that.
In the meantime, best of luck with your pattern finding and trading.
Thanks for these candlestick tests. Very informative. Keep them coming!
No problem Eric, more to come.
Dear JB,
Thank you for taking the time to test the candlestick reversals. I have a list of best performing candlestick patterns as suggested by Thomas Bulkowski.
Here is the link, http://thepatternsite.com/CandlePerformers.html
His patterns are slighly more complex and may requires discretionary interpretation like the current trend leading to the candles etc. Hope you are up to the challenge =)
Was pretty amaze by the reversal percentage according to his backtest. It will be extremely useful for technical users if you are able to validate them.
Also on one request, whether you can separate the results for stocks and forex data statistics. As i find them to be not as correlated in terms of the technical aspects . I read from books and author like Ponsi mentioned that fibonacci retracements and candlesticks patterns are more successful in trading forex rather than stocks or futures as there are more participants using technical analysis on forex. This will gives us a better idea on the technical impacts on both stocks and forex.
Once again thank you! And keep up the good work. Cant wait for you to update your Udemy courses with more trend following and momentum strategy.
Regards,
Kayson
Thanks for the link and suggestions. Cheers