In this post I test nine different moving averages in order to see which is the best moving average for trading. Two different strategies and markets are tested. The results may surprise you.
What are moving averages?
Moving averages plot the average price of a security over a set number of periods or days and they’re an extremely popular tool used by traders to determine the overall trend.
Moving averages smooth past price data so traders can more objectively see the recent trend. They filter out the noise which makes it much easier to see what direction a market is heading.
Moving average crossovers
The most common way to use moving averages is to look for moving average crossovers and this technique has been used by many successful trend followers.
When a fast moving average (such as a 5-day MA) crosses over a slow moving average (such as a 20-day MA) it signals a new uptrend is taking place and is a bullish signal for a trend follower, telling them to buy the market.
When the fast moving average crosses back under the slow moving average, it signals that the uptrend has come to an end and a new downtrend is in place. This is a bearish signal for a trend follower, telling them to close their long trade or go short the market.
The biggest problem with moving averages
The biggest problem with moving averages (like all technical indicators) is that they are lagging indicators.
Since they make a calculation based on previous price data, they can only ever tell you what has happened in the past and not the future. The longer the look-back (or number of days/periods used in the calculation) the more lagging the indicator will be.
For example, a 5-day moving average will be a lot more responsive to recent price moves than a 200-day. However, because of this, a 5-day moving average will also have considerably more noise, negating the effect of the moving average in the first place.
Thus, all moving averages are a trade-off between noise and lag. Faster MA’s respond to new trends quickly but they show more noise and lead to more whipsaws. Slower MA’s are better at smoothing noise but they can be late to find new trends.
Different types of moving averages
Because of this trade-off between noise and lag, a number of traders have attempted to improve on the simple moving average calculation.
The simple moving average is fairly easy to calculate and so the indicator is carried by nearly all trading platforms. Nowadays, all you need to do is click a button and the moving average can be plotted onto your price chart.
However, by making the calculation more complex, many developers have attempted to come up with faster and smoother versions, designed to better track trends.
In the rest of this article, I shall go through nine different types of moving averages and then we shall put them to the test on historical stock market data to see which one is best.
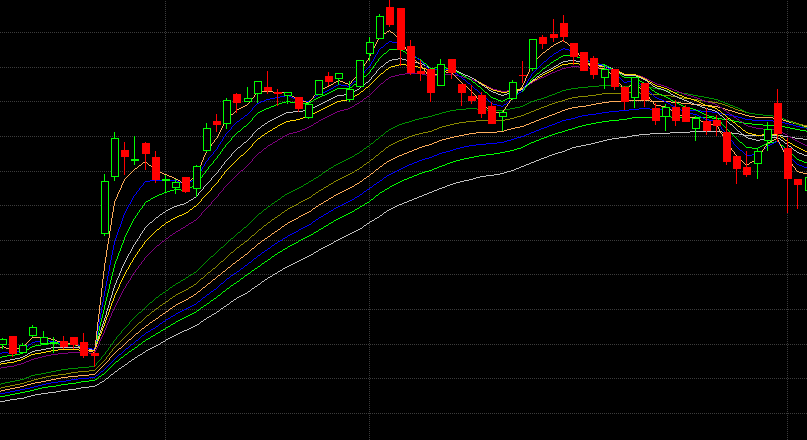
Shows first 8 moving averages plotted together
Exponential moving average (EMA)
We have already seen how the simple moving average is calculated so the next most popular moving average is known as the exponential moving average (EMA).
The exponential moving average works in the same way as the simple moving average but it gives greater weight to more recent price moves. (More recent price data is weighted in an exponential fashion).
It is therefore able to react faster to new trends but could therefore lead to more whipsaws. The EMA is also very popular and available on nearly all trading and technical analysis platforms.
Double exponential moving average (DEMA)
As the name suggests, the double exponential moving average (DEMA) is a faster version of the exponential moving average. Although the calculation is actually based on both a simple MA and a double EMA.
The indicator was first developed by Patrick Mulloy in a February 1994 article of Traders magazine. The most important thing to note is that this is a moving average that reacts quickly to new price moves.
Triple exponential moving average (TEMA)
Like the DEMA, the triple exponential moving average (TEMA) was also developed by Patrick Mulloy. It is formed from the composite of an EMA, a DEMA and triple EMA. As such, it significantly reduces lag and reacts quickly to new price moves.
The TEMA can be so quick that it can also overshoot the market, which means it sometimes goes too far and moves beyond the recent price action. This is another downside to using fast MAs.
Wilders moving average (WILDERS)
The Wilders moving average was developed by J. Welles Wilder in his 1978 book: New Concepts In Technical Trading Systems. The indicator is calculated by altering the original exponential moving average formula.
Instead of using the original formula EMA% = 2/(n+1), where n is the number of days, Wilders uses a slightly different calculation with an EMA% of 1/14. The upshot of this is that the Wilders moving average is slightly slower than the EMA but faster than the SMA. With this formula, a 27-day WMA is equivalent to a 14-day EMA.
Weighted moving average (WMA)
The weighted moving average (WMA) is designed to find trends faster but without whipsaws. It’s calculated by multiplying each data point by a different ratio and then takes the sum of all those products. This makes it faster than the typical EMA.
The calculation is quite complex, using the formula n/d, where n is the day numerator and d is a triangular number. You can see how it works here.
Least squares moving average (linear regression)
The least squares moving average is sometimes called an end point moving average and it’s based on linear regression. In essence, the linear regression line is projected forward indicating what would happen if the regression continued forward. You can see it’s calculation here.
Hull moving average (HMA)
The Hull moving average (HMA) was developed by Alan Hull in a bid to create a moving average that was fast, responsive and with reduced lag. According to Hull, the HMA “almost eliminates lag altogether and manages to improve smoothing at the same time.”
The HMA is fairly complex to calculate so you can read more about the method here. This is a moving average that is rarely found on popular trading platforms but is considered by some to be a very good indicator.
Guppy multiple moving average (GMMA)
The Guppy multiple moving average (GMMA) is different to the other MAs discussed here because it is a combination of several exponential moving averages at once. Since it may interest readers, I will test the GMMA method as well but in a different way to the others. So I will be going long when the close crosses the GMMA.
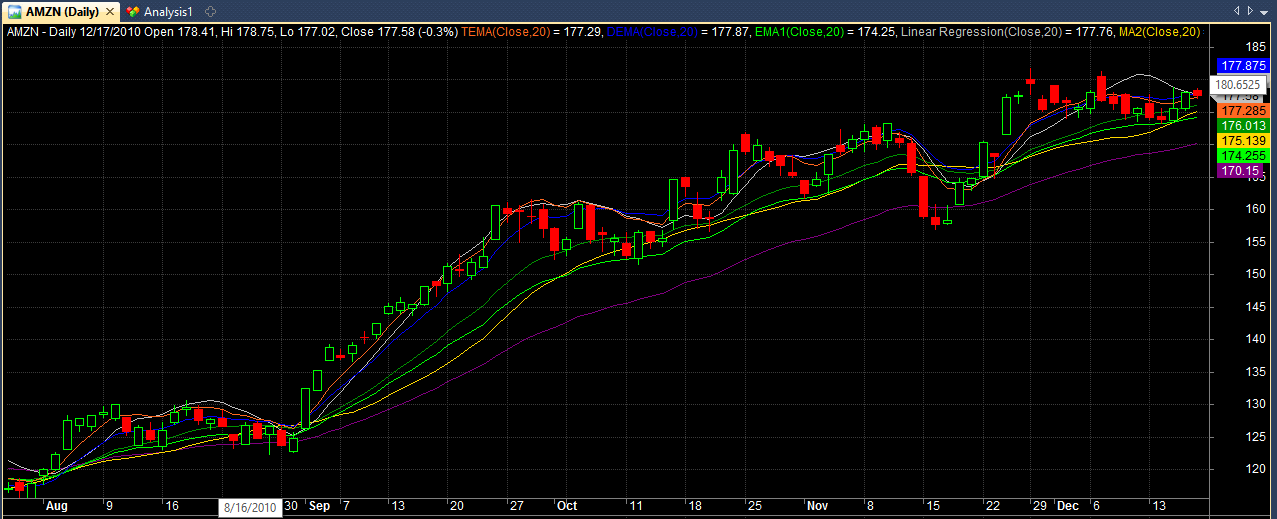
For the test, I will be using the following EMA parameters: 3, 5, 7, 10, 12, 15 and 30, 35, 40, 45, 50, 60. As shown in the chart below:
Which is the best moving average?
Now that we have discussed the different moving averages we can start putting them to the test to see which moving averages are most effective at finding and trading trends.
It should be noted at this point that the tests are not designed to find the perfect settings but to get a rough idea as to which moving averages work best.
Two different test will be run, a long-only, moving average crossover comparison on the S&P 500 Index, and a portfolio test.
1. S&P 500 crossover test
The rules of this test are simple.
We will buy the S&P 500 whenever the faster moving average crosses over the slower moving average, indicating an upward trend. We will sell our position when the fast moving average crosses back under.
For each moving average type, two different crossovers will be tested – the 5-day/20-day crossover and a longer, 50-day/200-day crossover (also known as a golden cross). In the case of the Guppy multiple moving average, we will buy the S&P 500 when the close crosses over every moving average line and sell when the close crosses back under every line.
Starting capital will be set at $10,000 and commissions will be $0.01 per share. Position size will be 100% with no leverage. The ticker used will be $SPX from Norgate Premium Data and the test will be run from 1/1/2000 to 1/1/2015. All moving averages will be calculated using the close price and entries/ exits will be made on the next day open (after a crossover takes place).
Hopefully this will lead to some interesting results.
S&P 500 crossover results
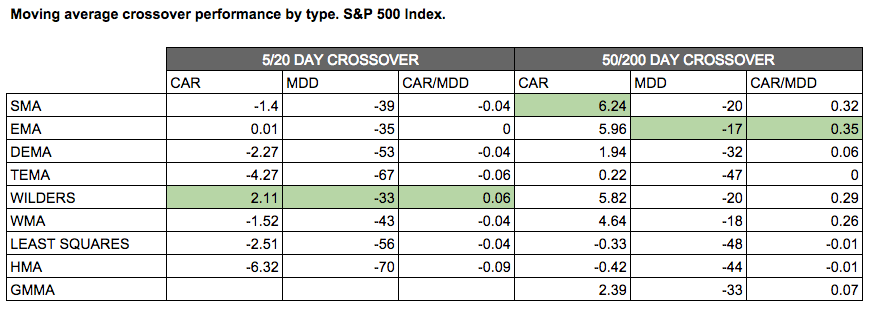
As you can see from the table, the best moving average for a 5/20 day crossover happened to be the Wilders moving average. The Wilders MA produced a compounded annualised return of 2.11% with a maximum drawdown of -33% giving a CAR/MDD ratio of 0.06. The worst performing average was in fact the Hull moving average.
Looking at the 50/200 day crossover, the best moving average was the exponential moving average (EMA) which gave a annualised return of 5.96% with a maximum drawdown of -17%. The worst performing moving average was tied between the Hull moving average and the least squares moving average.
2. S&P 100 portfolio test
This test will be the same as above except we will be running a 10-position long only portfolio system and our watch-list will be the S&P 100 universe of stocks (which includes historical constituents).
Whenever the fast MA crosses the slow MA on a stock in the universe, we will buy it and add it to the portfolio. Whenever it crosses back under, we will sell the stock and it will drop off the portfolio. Entries/exits will be made on the next day open and duplicate signals will be ranked by the RSI(14) indicator (strongest stocks preferred first). In addition, the stock must be priced over $2.
Commissions will be set at $0.01 per share and our starting equity will be split equally between each position (equal weighted portfolio).
S&P 100 portfolio test results:
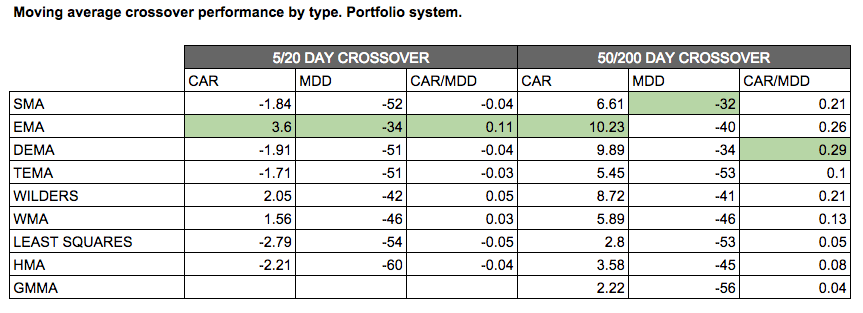
As you can see from the table, the best moving average for a 5/20 day crossover was the exponential moving average (EMA) which gave a compounded annualised return of 3.6% and a maximum drawdown of -34%, resulting in a CAR/MDD of 0.11.
The worst performing moving average was the least squares.
Looking at the 50/200 crossover, the best performing moving average was the double exponential moving average (DEMA) with a CAR/MDD ratio of 0.29 and an annualised return of 9.89%. The worst performer was the GMMA strategy.
Conclusions
When looking at the range of results, it’s clear that we can come to two conclusions. Firstly, longer term moving average crossovers work better than short-term crossovers. This is likely because they produce fewer whipsaws.
Second, newer and more complex moving averages appear to be no better at finding trends than the more traditional moving averages.
No doubt indicator developers will insist that their parameters be changed, to better reflect how their product is intended to be used. There may be some truth to that. Indicators such as GMMA and least squares are not necessarily intended to be used in this manner.
However, altering the parameters in such a way could be construed as curve-fitting and would lead to unreliable analysis.
Personally, the conclusions confirm what I thought all along. Simple moving averages work just as well as complex ones at finding trends, and the trusted, exponential moving average is best.
You may also like:
– Testing moving average crossovers on stocks
– Bollinger Band trading strategies put to the test
– 30 trading strategies for stocks.
All tests run using Amibroker using Norgate Premium Data.
Your blog post(s) are really outstanding. In-depth thought. Very interesting.
I get it. MOVING AVERAGES are a key component of a trader’s toolbox. I have to be an expert of them.
I am really flaggergasted with the amount of useless information you can find out on the web. Ditto for the “gems”. Your blog belongs to the latter.Thanks for your writings!
Tom
Thanks for your message Tom, moving averages are definitely a tool to get the hang of. They are flexible and can be used for many purposes, not just for identifying trends. Hope to post more articles like this one soon. Cheers
Hi Joe,
According to the 2nd table, the EMA is the best in the 50/200 test, with 10.23%
Although it gives a slightly lower CAR, the DEMA has a smaller drawdown and it therefore gives a better CAR/MDD ratio. The CAR/MDD ratio is my preferred objective function.
Hi JB,
From your experiment, it might concludes that using a smoother MA like hull moving average is as good as following the price trend itself and therefore doesn’t provide any significant predictive function for the past or future. Similarly, using a too complex one which involves over curve-fitting is of little value for the future. Simple works and you proven it again!
Hopefully you will also have some time to test in using complementary MA crossover which some experts suggest that they work better in providing less delayed profits taking (some common ones are like SMA over EMA, SMA over WMA, and EMA over WMA etc).
Thank you for your effort and i learnt alot taking your courses in udemy.
Thanks, glad the article and the courses have been useful. I will definitely revisit moving averages and the Hull MA at some point. Cheers.
Thanks for posting these results JB. I’ve always liked the EMA. I think Alan Hull has done some interesting work to develop the HMA. I would note that on his website he says this about the HMA and its use in crossover systems:
“A simple application for the HMA, given its superior smoothing, would be to employ the turning points as entry/exit signals. However it shouldn’t be used to generate crossover signals as this technique relies on lag.”
Looks like your testing validates his point.
Yes, I do like the HMA, I should take a look at it again at some point.
Hi JB,
Check the calculation for moving averages in the section labeled “Wilders moving average (WILDERS)”, and you will see that you have a typo. The second half of the second paragraph should read:
The upshot of this is that the Wilders moving average is slower than both the EMA and the SMA. With this formula, a 27-day EMA is equivalent to a 14-day WWA.
Thanks,
Bob
Hi Bob, nice spot. Cheers JB
You cannot compare MA’s with the same parameters because they are all calculated in a different way and thus have different phase and speed. What really should have been done is perform a series of optimizations and compare the best performing and worst performing cases.
That’s a great idea, thanks
i didnt bother to read everything in detail. if you have done a smple moving average cross strategy test. thats not an accurate way to comapare them. hull moving average for example isnt based on cross overs. alan hull said you should put one on your chart and just play the slope changes. comapring simple and exponential averages are decent i guess.
Ok.
Interesting but Not what i have experienced. If you were using actual Two separate HULL MAs that are able to cross each other. I use multiple Hull MAs that Cross each other, like a 34Hull crossing above a 89 hull, for Trend changes, with price getting above Hull 200, and then a 15hull crosses above 34 hull for a long entry setup.
Nope. You used Hull incorrectly. It’s inventor said it is not to be used in crossover strategies. It’s a stand-alone indicator. Increasing means go long. Decreasing means go short.
Ok.