
Trend followers do not aim to buy the market right at the bottom nor sell at the high.
Instead, they buy the market as it moves up and sell the market as it moves down. On the other side, they short the market as it goes down and cover the market as it goes up.
This way, they catch the meat of the move and wind up making a good deal of money.
How to follow the trend?
A common mistake that some traders make is trying to come up with an elaborate method or system for following the trend. The truth is there are numerous ways to find trends and simple methods are just as good as complex ones.
When you think about it, the idea of a trend is in itself, quite an abstract thing that depends on the timeframe you are looking at.
Indeed a market can quite easily be trending upwards on a monthly chart but downwards on an hourly chart.
What is the definition of a trend?
You could say that a trend is simply a general direction of something. And partly because of this vague definition, other factors such as the market timeframe and the diversification of the portfolio take on extra significance.
The most important thing therefore, is to find the really big trends, the trends large enough and frequent enough to make good money trading them.
If a stock is going higher and higher, then nearly every trend following indicator under the sun will indicate an upward trend.
It is therefore not necessarily so important which indicator you choose.
The important thing is to find the trend following indicators that work for you and the trend following rules that work for you and to stick to them.
So now we have established the importance of finding big and reliable trends, here are 10 different and new ways to follow the trend.
Along with these methods, I will scan the market and so provide the number of new signals provided by each method.
I will suggest that good trends are not easy to come by, so the trend following methods with fewer signals should be more robust than the methods with more signals.
10 more ways to follow the trend
The examples provided here will be for finding uptrends but the exact same process can be used to find downward trends.
#1. 52 Week High/Low
It’s reasonable to conclude that if a stock makes a new 52-week high it’s in a pretty strong upward trend. And likewise, if it’s just made a new 52-week low it will be in a strong downward trend.
This is the basis of many successful trend following systems.
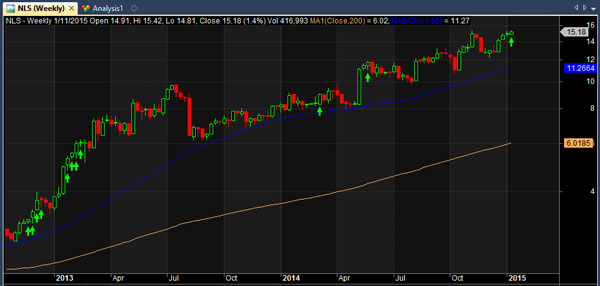
However, consider the following two stocks, both of which have just made new 52-week highs:
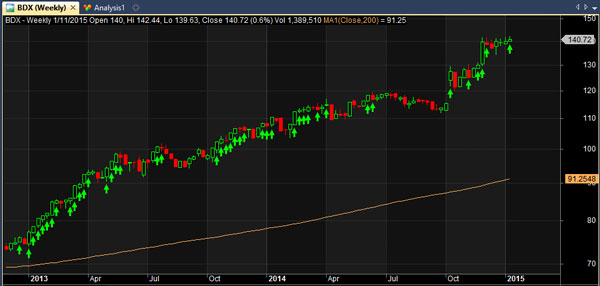
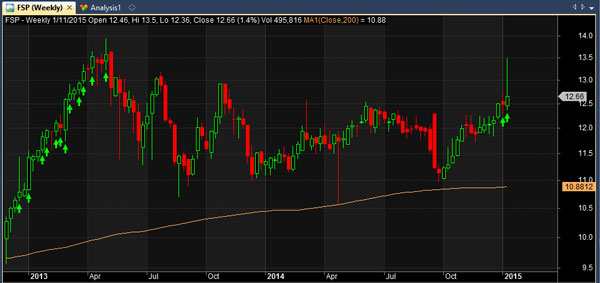
You can see that the first stock has been gradually trending higher while the second was in range-bound territory before a big move made it spike through it’s 52-week high.
For trend followers, the first stock should provide more reliable returns than the second – though a trader can never be 100% sure which trend will be the smoothest.
Scanning the database of S&P 1500 stocks for the week of 5 January 2015 resulted in 33 companies making 52-week highs.
#2. Moving Average Crossover
Another common trend following indicator is the MA crossover as it shows objectively when a market is gradually trending higher or lower.
By this reasoning, when a fast moving average such as the 50 day MA crosses over a slow moving average such as the 200 day MA, it’s reasonable to conclude that an uptrend is in place.
This is exemplified in the following chart for Healthways Inc. $HWAY:
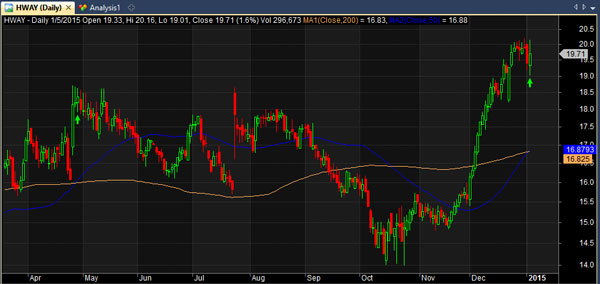
The 50 period MA is in blue and the 200 MA is orange. You can see that the upward trend is already developing.
Scanning the database of S&P 1500 stocks for the week of 5 January 2015 resulted in 11 stocks making a bullish 50/200 MA crossover.
This isn’t so many and there were some stocks in there, that to the naked eye, did not look like in an uptrend at all. That is the advantage of using the moving average crossover.
#3. Using RSI
The Relative Strength Index is an oversold/overbought oscillator that is most often used as a mean reversion indicator. But in this instance we can use it as a trend following indicator too.
Simply, when RSI has reached an extreme level such as 70, it is reasonable to conclude that the market has moved upwards aggressively and a new uptrend is in place.
And as you can see for the below stock $ACC, the RSI crossing over 70 has previously been a good signal to join the upward trend.
By the way, buy signals are shown by the green arrows.
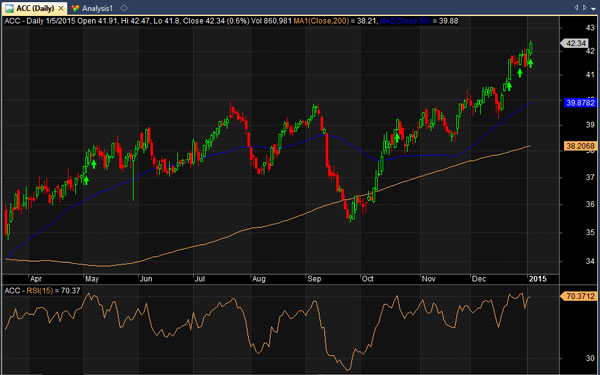
Scanning the database for the first week of January 2015 for stocks with daily RSI(14) crossing over 70 resulted in 10 signals.
#4. 4 Weeks Higher Close
Another way to find a stock that is trending higher is to simply to look at it’s most recent performance.
If a stock has closed higher for four weeks in a row for example, the weekly chart will show four bullish candles. This is another reasonable indication of an uptrend.
Scanning the database of S&P 1500 stocks for the week of January 5th 2015 for stocks with 4 weeks of consecutive higher closes resulted in 61 signals.
I suggest that this is quite a large number of signals, indicating that this method is potentially hazardous for trend traders.
Traders cannot wish for there to be so many good trades to take.
#5. Linear Regression
There is nothing fancy about the linear regression indicator. It is simply another way of identifying whether a market is moving up or down.
In this case, the indicator plots the end points of whole series of linear regression lines. It identifies trends more quickly than a moving average but is therefore more prone to whipsaws.
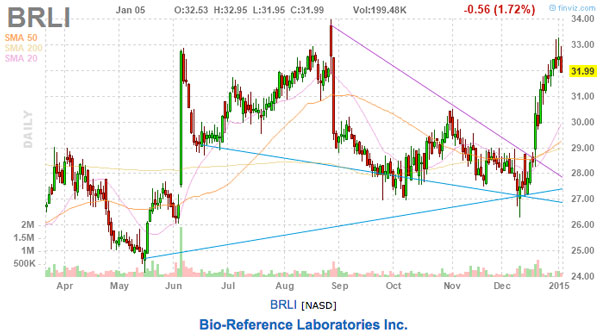
Scanning the database of S&P1500 stocks for a linear regression 50 day/200 day crossover gave 4 signals including this one for $BRLI:
In my course, I use the linear regression indicator in a trading system but I smooth the indicator with a moving average to make it more stable.
#6. Momentum Indicator
The momentum of a security is the ratio of today’s price compared to the price x-number of periods ago. It can easily be combined with volume but in this instance we ignore volume and conclude that a stock is in an uptrend if the momentum ratio has crossed the zero line.
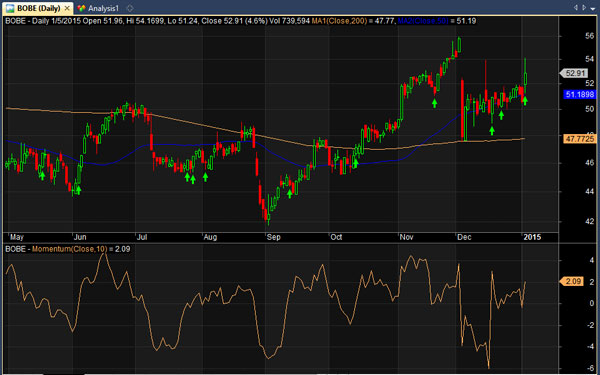
As seen from the chart for $BOBE, the momentum indicator can pick out upward trends when the zero line is crossed.
(The green arrows indicate when the zero line has crossed).
However, the indicator also picks out some more dubious choices, like this one for $RYAM:
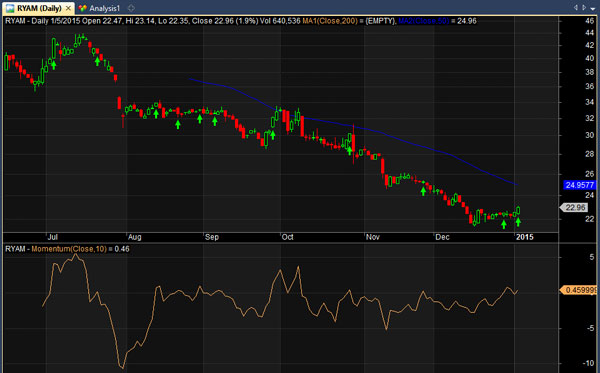
Scanning the database resulted in 11 stocks crossing the daily momentum zero line.
#7. Google Trends
Although the essence of trend following is to follow price alone, it may be worth investigating other factors, for example earnings data, sentiment data, or even search engine data. Later, we may be able to combine them with price indicators to form a strategy.
The database of trading systems at Quantpedia links to an interesting strategy that is based on search data from Google. The idea is that when a company is searched for many times, it is more popular and likely to see it’s share price appreciate.
In this example, I’ve compared the Google search data for “Pfizer Inc” (top) with it’s share price (bottom):
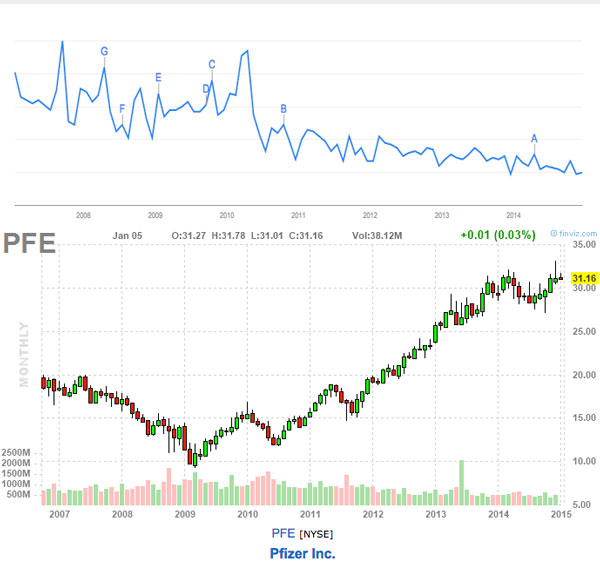
Looking at this alone, there appears to be no real connection.
The number of Google searches for Pfizer Inc has clearly been trending downwards whereas the stock price has soared.
However, there is some use in using Google data, particularly for identifying sector trends and another interesting example was shown with the search term “debt”.
It’s worth looking into further and I will do that at some point.
#8. Earnings Trends
As I said, trend followers should focus on price and this is particularly true in commodity and currency markets.
In stocks though, earnings trends can be extremely useful since a stock price always converges with it’s earnings line over time.
Thus, a stock whose earnings is trending higher will likely see it’s stock price also trend higher.
You can clearly see this taking place in the next chart for McDonald’s $MCD.
Earnings per share, represented by the blue line, has moved in lock-step with the share price, represented by the green line, since 1996:
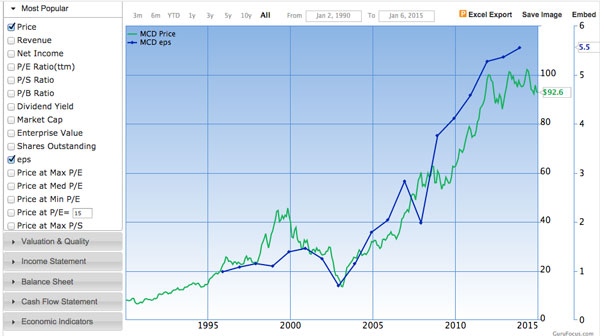
Chart provided by Gurufocus.com
#9. Volume and Price
Of course, another way to follow the trend is to combine indicators together and there is no better combination than using price with volume.
Volume is such a good indicator to use since it highlights how market participants are behaving.
When a stock moves higher on large volume it’s an indication of many traders coming together to buy the stock.
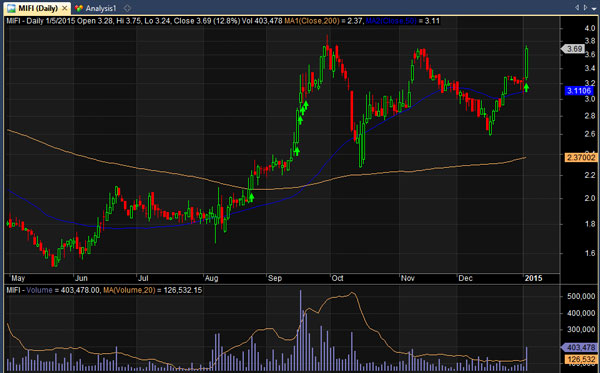
In this example, I scan for stocks that have hit 52-week highs and whose volume is also twice as large as the 66 day moving average.
Scanning the database produced 6 signals including this one in $MIFI:
#10. Create Your Own
What you will find by looking into different trend following indicators is that many of the same stocks will keep popping up.
That’s because every indicator essentially tries to do the same thing; find a stock that is moving higher.
You should feel free to move away from the normal and create your own conditions for following the trend.
By combining indicators or by adding fundamental considerations, you should be able to find stronger, more robust trends.
And robust, reliable trends are what every trader wishes for.
Scans were made using Amibroker with stock data from Norgate Premium Data.
Did you like this post? Please share and comment, your feedback is welcomed.