
RSI is one of the most popular technical indicators among quant traders, particularly the 2-period and 4-period RSI.
Previous analysis and articles have shown how RSI(2) maintained a strong edge in stocks through most of the 2000s.
The MFI indicator (money flow index) is similar to RSI but incorporates volume as well.
MFI is not as popular as RSI, however, MFI works just as well, and in many cases, works better than RSI for short-term trading and swing trading.
What is the Money Flow Index Indicator (MFI)?
Like RSI, Money Flow Index measures the speed of price movements. But unlike RSI, it also measures the strength of money flowing into and out of a stock. It does this using volume.
Amibroker.com has a good definition of MFI on their website which is summarized as below:
To calculate MFI you must first calculate MoneyFlow which is determined by multiplying the average price of the day by the volume.

Next, you must separate the money flows into positive and negative values to work out the MoneyRatio. If the price was up on a particular day you call it Positive Money Flow and if prices are down it’s called Negative Money Flow.
The MoneyRatio can now be normalized into an oscillator form which means it can be easily used (just like RSI) to identify oversold and overbought conditions.
When MFI is low it means selling pressure is stronger than buying pressure and vice versa. Like RSI, traders look to buy when the MFI is oversold such as below 30.
Money flow index vs RSI reveals that the money flow index indicator is does a similar thing but often does it better than RSI. It is also perfectly reasonable to use RSI-MFI combined.
RSI vs MFI – which one should you use?
To test the MFI indicator I loaded up some backtesting software with historical stock data from Norgate Data. I then ran a number of tests to compare the two indicators.
3-Day Holding Period
The following table compares RSI buy signals with MFI buy signals over a holding period of three days between 1/2008 – 1/2018 on 10,000 US Russell stocks.
No commissions are included and all entries/exits are based on the next day open price.
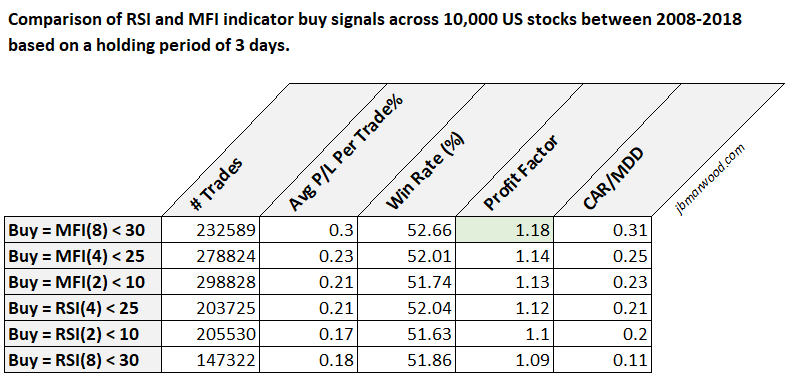
As you can see from the table above, the MFI indicator produced better results than the standard RSI over a holding period of three days.
The buy signal MFI(8) < 30 produced the best results with an average profit of 0.3% per trade, a win rate of 52.66% and a profit factor of 1.18 from a large sample of 232,589 trades.
This was superior to the buy signal RSI(8) < 30 which gave an average profit of 0.18% per trade and a profit factor of 1.09.
5-Day Holding Period
The following table compares RSI buy signals with MFI buy signals over a holding period of five days:
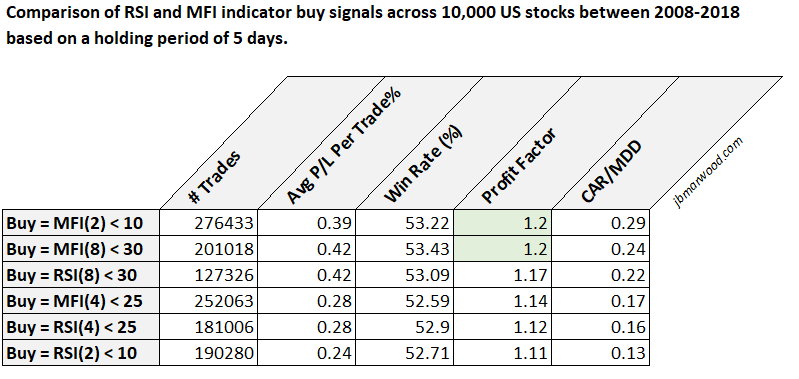
As you can see from the table above, the MFI indicator produced better results than the standard RSI over a holding period of five days.
The buy signal MFI(2) < 10 produced the best results with an average profit of 0.39% per trade, a win rate of 53.22% and a profit factor of 1.20.
This was superior to the buy signal RSI(2) < 10 which gave an average profit of 0.24% per trade and a profit factor of 1.11.
10-Day Holding Period
Since a 5-day holding period produced some clear results we can also run the same test using a 10-day holding period.
Note that a 10-day holding period usually produces better results due to the upward drift of stock prices and we don’t like to go much longer than this in our analysis:
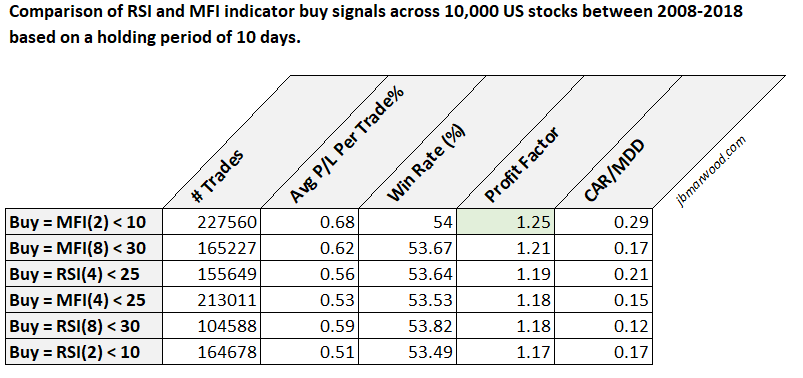
As you can see from this table, MFI indicator once again produced the best result.
The buy signal MFI(2) < 10 gave us an average profit of 0.68% per trade with a win rate of 54% and a profit factor of 1.25.
This is the best result we have achieved so far.
MFI vs RSI – Conclusion
RSI is a popular technical indicator among traders but the MFI indicator is rarely talked about.
However, you can see from the results that the Money Flow Index is just as good, if not better than RSI at picking oversold stocks.
These results are based on a large sample of trades across 10 years of historical data. The results also incorporate delisted stocks in order to avoid survivorship-bias.
It’s quite clear that the MFI indicator works just as well as RSI.
Simulations in this article produced with Amibroker using historical data from Norgate.
Some questions:
1) How were the 10,000 stocks selected?
2) Were there any constraints on how many positions could be held at once?
3) If the system was already long a stock, would it buy in again (e.g., if a signal occurred two days in a row)?
4) How does perf. look when using only stocks with > $10m average daily volume?
5) Most importantly, how does perf. look for only the last 2-3 years?
Thanks!
1) Russell 3000 stocks watchlist from Norgate data – around 10,800 stocks total
2) Not really. Max would be about 2000 open positions
3) No. No new signals until trade is exited.
4) No idea sorry!
5) See https://stocksoftresearch.com/wp-content/uploads/2018/11/10-day-mfi-2.png MFI(2) < 10, holding period 10 days
Thanks. Appreciate all the info.
For calculating MFI(2), wouldn’t two down days produce a 2-day MoneyRatio of 0 and two up days produce a div by zero error?
I think if there is no negative money flow you divide by 1 but I could be wrong
Hmm. Seems like roughly a quarter of all stocks would have the max MFI(2), and a quarter would have the min MFI(2) on an average day. I must be missing something.
It makes a lot of sense to take volume into the model.
Consider the example of a company where news are announced when markets are closed. The stock gaps down on opening causing the RSI to plunge. But if no volume was traded, is it really oversold?
I would argue that it may make sense to extend the model with free float or historical average traded volumes to put volume in perspective.
I wonder how “Buy all R3000 stocks that have closed down in consecutive days” performs?
That’s a good idea might try it for 2-3 days
Do you know if there were any instances where all the MFI conditions were met? MFI(2) < 10, MFI(4)< 25 and MFI(8) < 30? If so, what was the win rate and Average P/L per trade%?
I’m sure there were but that is not something I tested sorry.
Top demais, vai agregar bastante!