Global stock markets started the month of July on the back foot following a Federal Reserve rate increase in June and some mixed economic signals.
However, by the end of the month equity markets were back to their all-time highs and the bull market in US equities continued. This came as US growth figures showed improvement and non-farm payrolls came in better than expected.
Given the relatively strong performance for US stocks in July, it’s no surprise that some of the trading systems on Marwood Research also had a stellar month.
Following are some highlights from our trading systems during the month of July:
Bar Strength
Bar Strength is a short-term mean reversion system that trades a handful of liquid ETFs and is part of HTS 2.
This system is long only and incorporates a market timing element.
Although it is backtested on only 7 ETFs it has also worked well on a larger universe of ETFs as well as individual stocks.
Bar Strength is having a good year in 2017 and July was also profitable with barely any drawdown.
The following results are based on a $50,000 equal weighted account without any leverage and include transactions costs of $0.01 per share:
- Net Profit: $1370.16
- Annualised Return: 42.25%
- Max Drawdown: -0.41%
- # Trades: 8
- Win Rate: 87.5%
- Avg P/L Per Trade: 1.71%
- Average Holding Period: 8 days
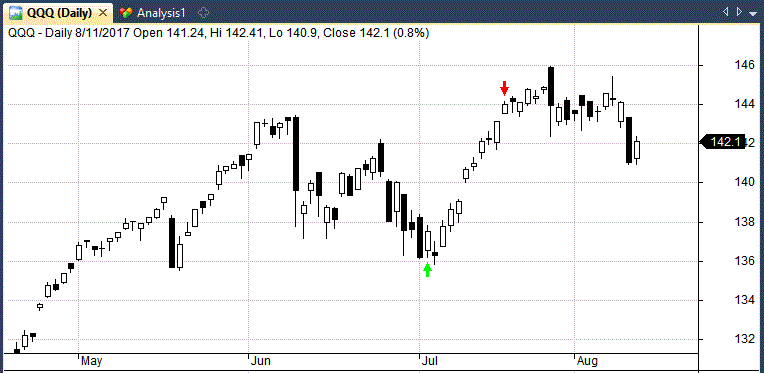
Bar Strength placed 8 trades in July with winners in XLE, IEF and GLD. The standout trade was this swing trade in QQQ which returned 5.08%:

Trading For Yield
Trading For Yield is the newest addition to Marwood Research. This is a short-term swing strategy based on an economic principle and mean reversion concept.
The system had another profitable month in July, placing five trades and winning each time. The 100% win rate is slightly misleading, however, because the trades are based on only one trading signal.
This systems trades ETFs that are not very volatile which means it could benefit from leverage or trading via options. The following results are based on an equal weighted $50,000 account with 2:1 leverage and transactions costs of $0.01 per share:
- Net Profit: $450.50
- Annualised Return: 12.40%
- Max Drawdown: -1.05%
- # Trades: 5
- Win Rate: 100%
- Avg P/L Per Trade: 0.45%
- Avg Holding Period: 6 days
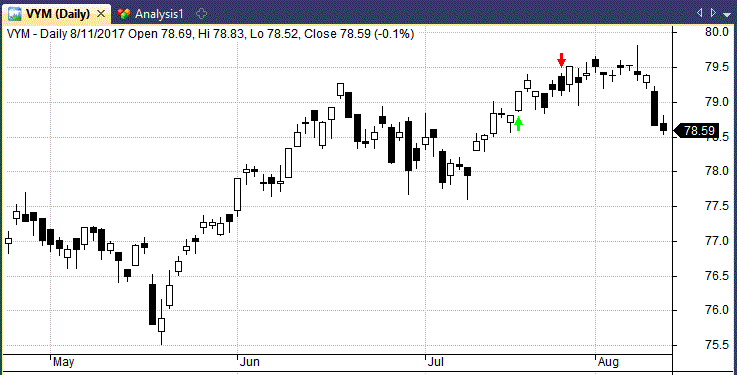
Following is the best win that was recorded in July – a nice swing trade in VYM:

Trend Pilot Twist
Included in HTS 1, our Trend Pilot Twist system is a semi-passive trend following strategy for the SPY ETF.
The idea of Trend Pilot Twist is to gain exposure to the market during strong periods and not get shaken out during volatile periods. It aims to beat buy and hold with a smaller drawdown and is built with only very simple rules.
This system could also work well on the E-Mini futures contract or individual equities.
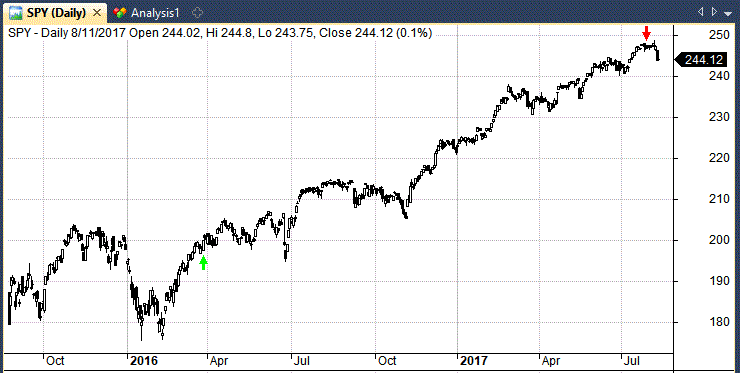
Trend Pilot Twist last went long on the 29th March 2016 and is still long as of 31 July 2017 – proving it’s ability to stay with the long term trend.
Marked to market, TPT produced a monthly return of 2% in July and is up 25% since the last buy signal. The following chart of SPY shows the most recent trade:

Summary
Observing out of sample performance of a trading system is a crucial process that can help judge a trading system’s quality and lead to important improvements to the model.
July was a good month for the systems on Marwood Research and some excellent trades were achieved. When combined with a traders own intuitions and experience, the results can be even better.
The results shown on this post are based on simulations for the month of July 2017 using Amibroker and historical data from Norgate and include transactions costs of $0.01 per share.
