• Skip to content
  • Skip to primary sidebar
  • Skip to footer

JB MARWOOD

  • Top Posts
  • Marwood Research
  • Resources
    • Books
  • Free System
  • Blog
    • About
    • Book
    • Signals
    • Q & A
    • Tweets
You are here: Home / Amibroker / Trading The Uptick Rule – Can You Make Money Buying Stocks After A 10% Drop?

June 8, 2018 By Joe Marwood Leave a Comment

Trading The Uptick Rule – Can You Make Money Buying Stocks After A 10% Drop?

The uptick rule is a short selling restriction that says you can only short sell a stock on an uptick. In other words, you must wait for a stock to trade a tick higher before you can short it.

This rule was first introduced in 1938 to promote market stability and investor confidence. However, the rule has always had critics and was pulled shortly before the financial crisis in 2007.

In February 2010, the SEC introduced an ‘alternative uptick rule‘ which restricts investors from short selling a stock that has dropped more than 10 percent in one day.

This short selling restriction starts from the moment the stock has dropped 10 percent and lasts until the close of trading on the next day.

Again, the idea of this circuit breaker is to prevent unrestricted short selling from driving down the price of an already beaten down company.

Although the rule is intended to improve market stability, some critics argue it does the opposite by preventing natural price discovery.

Buying Stocks After A 10% Drop – The Alternative Uptick Rule

Since the alternative uptick rule restricts short selling after a 10 percent decline, it might seem a good idea to go long when the circuit breaker takes effect.

The following cherry picked chart shows a great example of this:

VECO trade example uptick rule

Veeco Instruments Inc. (VECO) fell 18.7% on the 8th December 2017. A short selling restriction would have then been applied. Going long on the next open and holding for one day would have returned a nice profit of 11%.

Test Results

If short sellers cannot go short, and must first wait for longs, surely there is a good chance that the stock will rise in this situation?

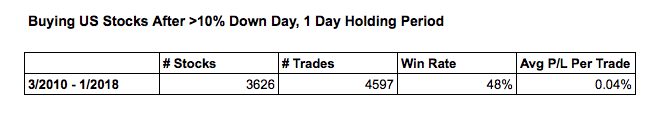
To test this theory, I ran a simulation on 3,626 US stocks between March 2010 (when the alternative uptick rule started) to January 2018 and found 4,597 times where a stock closed 10% or more below the close of the previous day.

In 2216 of those occurrences (48%) the stock moved higher the next day giving longs a profit.  In the other 2381 times (52%) the stock carried on lower, giving a loss.

The average gain from winning trades was marginally larger than the average loss from losing trades resulting in a profit overall.

However, the average profit per trade is only 0.04% and this is before commissions and slippage.

Alternative uptick rule trading strategy results on US stocks

This edge is not large enough to cover transaction costs and is less than the average daily return of all stocks in the sample (+0.07%).

In other words, the introduction of the uptick circuit breaker does not lead to a significant rally for stocks on the next trading day. This is not a worthwhile trading strategy.

Including Transaction Costs

As the following equity curve and profit table shows, the strategy of buying stocks after a 10% drop and holding for one day has been a consistent losing strategy once transaction costs ($0.01 per share) and portfolio settings are applied:Buying stocks after a 10 percent drop uptick rulebuying stocks after a 10 percent drop table of results

Final Thoughts

Buying a stock that has a short selling restriction sounds like it could be a logical strategy but the data shows that this has been a losing strategy in the US stock market after commissions.

It should be noted that just because new shorts are not allowed to enter the fray, there are still existing stockholders who may use the opportunity of the circuit breaker to sell their positions.

Short sellers are also able to enter trades on certain stocks and on any uptick so they are not completely restricted.

Overall, the evidence shows there is no edge from buying stocks after a 10% drop. If there was any profit, it is wiped out after transaction costs.

Next time you see a stock with a short selling restriction you can bear this in mind and think twice about going long.

—

If you are interested in trading strategies that do show a historical edge please see our research program Marwood Research. Our program now includes over 20 trading strategies with full source code and 12 premium courses. Learn systems, backtesting and automation.


Simulation and charts in this article from Amibroker using data from Norgate Premium Data.

Stocks were selected from the S&P 1500 universe with a minimum turnover of $500,000. Includes delisted stocks. All trades executed on market open price.

—

DON'T MISS THIS


Filed Under: Amibroker, Stocks, Strategies/ Systems Tagged With: amibroker, stocks, strategies

Recommended Educational Resources:

  • Discover New Trading Systems
  • Build A Trading Robot In Excel
  • Learn About Mental Models (Free)
  • Learn Python (Free)
  • Free Historical Data
  • Free Indicators For Amibroker

Reader Interactions

Leave a Reply Cancel reply

Your email address will not be published.

Primary Sidebar

Access Marwood Research image
Joe Marwood Profile PIc

DON'T MISS THIS


Popular

roadmap to successful financial trading

Zero To Hero: 5 Steps For Financial Trading Success

vrsn example moving average pullback trade

Trading The 200 Day Moving Average Pullback On S&P 500 Stocks Doesn’t Work

Testing The RSI Model From The Quantitative Technical Analysis Book By Howard Bandy

10 things that dont work trading stocks featured image

10 Things That Don’t Work Trading Stocks

positions sizing with RSI 2 on spy equity curve

Using The RSI Technical Indicator For Dynamic Position Sizing

21 Useful Ways To Improve Your Trading System

Volatility strategy featured image

Simple Volatility Strategy For VXX

beware youtube trading videos

Beware YouTube Trading Videos

Financial Disclaimer

Financial trading is risky and you can lose money. JB Marwood is not a registered investment advisor and nothing on this site is to be regarded as personalised investment advice. Past performance is not indicative of future results. Data errors and mistakes do occur. Please see the full disclaimer.

Search

Recommended Resources

  • Discover New Trading Systems
  • Build A Trading Robot In Excel
  • Learn About Mental Models (Free)
  • Learn Python (Free)
  • Free Historical Data
  • Free Indicators For Amibroker

Footer

About The Author

Joe Marwood is an independent trader and investor specialising in financial market analysis and trading systems. He worked as a professional futures trader for a trading firm in London and has a passion for building mechanical trading strategies. He has been in the market since 2008 and working with Amibroker since 2011.

Joe Marwood Profile PIc

Recent Posts

  • How To Trade Double Tops – Historical Analysis
  • These 3 Charts Pose Difficult Questions For Index Investors
  • 5 Questions You Must Ask Before You Start Trading
  • Testing 3 Divergence Trading Strategies On Stocks
  • How To 10x Your Momentum Returns
  • Why Professional Traders Don’t Use Stops
  • Mastering Amibroker AFL
  • RSI Or MFI – Which One Works Best?

Search

Tags

10ideas (1) Amibroker (82) Books (14) Commodities (5) Data (1) Economy (3) Forex (14) How to (46) Ideas (20) Interest (5) Intraday (17) Investing (47) Latest (23) Legends (11) Links (27) Lists (48) Me (5) News (2) Opinion (33) Picks (74) Psychology (6) Q&A (1) Rant (1) Reviews (9) Roadmap (1) Sports (3) Stocks (137) Strategies/ Systems (140) Technical Analysis (25) Tips (3) Tools (19) Top Posts (27) Trading (21) Traps (1) Trend Following (18) Update (27)

Privacy policy | Contact | Disclaimer | All Rights reserved. JB Marwood.