In this article I look at the advantages of a barbell trading strategy and then I put the strategy to the test using historical stock data. As you will see there are some pros and cons to using this technique.
The Barbell Trading Strategy
Just recently I have been reading The Safe Investor by Tim McCarthy. McCarthy is a seasoned finance professional having served as President and COO of Schwab Corporation and this is an excellent book about safe investing ideas.
One part that caught my attention was the story of ‘the Alligator Flea’. The Alligator flea is the nickname given to a very successful investor from Hong Kong. According to the book, the Alligator Flea would take considerable risk in a transaction over a brief period, watching it even by the hour, while at the same time balancing that risk with an ultraconservative portfolio.
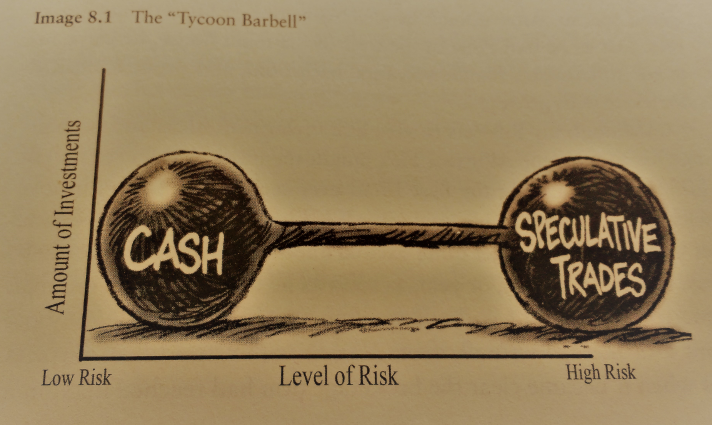
Because half or more of the money is in very high risk bets, the portfolio is balanced with virtually no risk in unconnected investments, a strategy known as the ‘Asian barbell’ or ‘Tycoon barbell’.
“Alligator fleas can jump around with no one noticing them, as they appear so small and unimportant. But when an opportunity arises, they can take a big bite in an instant.”
This idea of the alligator flea and the barbell trading strategy also reminds of Nassim Taleb who describes a similar strategy in Antifragile:
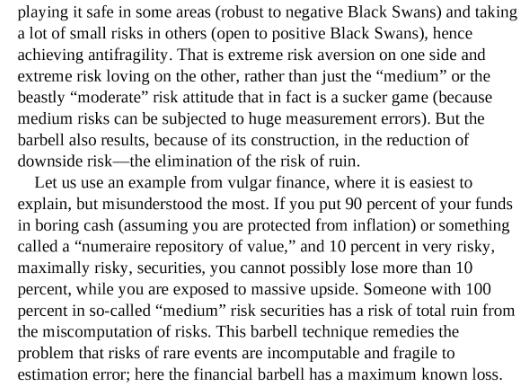
As Taleb puts it, the barbell strategy remedies the problem of being over exposed to rare risk events while leaving the upside open.
To me, this idea of a barbell trading strategy sounds convincing so I decided to put some ideas to the test using my back-testing platform Amibroker.
Testing The Barbell Trading Strategy
In Antifragile, Nassim Taleb recommends a barbell-type strategy where 90% of funds are put into boring cash-like investments, while 10% is put to work in very risky securities.
Taleb argues that this method protects us from negative black swans but leaves us open to positive black swans. I seem to recall that he mentions microcap stocks as examples of possible positive black swans.
A tiny biotech stock for example can surge thousands of percent if it is able to find a breakthrough drug. This is just one example of a positive black swan.
With this knowledge in mind I loaded up Amibroker and designed a simple trading strategy that puts 90% of capital into Treasury ETFs and 10% into Russell microcap stocks (rebalanced annually).
The exact allocation is shown below:
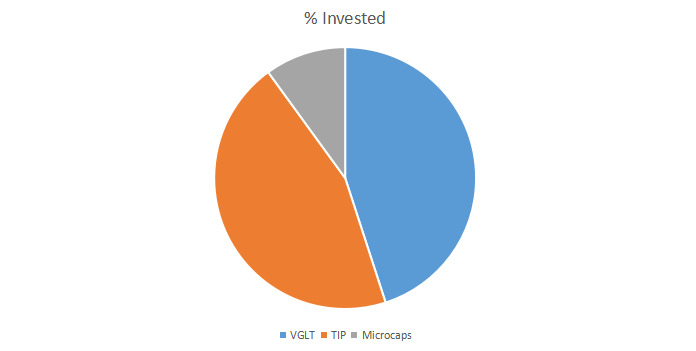
For a $100,000 portfolio, $45,000 is placed in VGLT (the Vanguard Long-Term Government Bond ETF), $45,000 is placed in TIP (the iShares Inflation Protected Bond ETF) and $10,000 is spread equally among 20 randomly selected microcap stocks.
The 20 microcap stocks are picked by random from the Russell Microcap Index and held for 12 months before being replaced each January. I also used a minimum price filter of $1 and a minimum average volume of 100,000 shares for liquidity reasons.
Barbell Trading Strategy Results
To analyse the effectiveness of the barbell trading strategy I ran the two strategies (90% cash, 10% microcaps) individually between 1/2010 and 1/2017 and then I combined the two equity curves together.
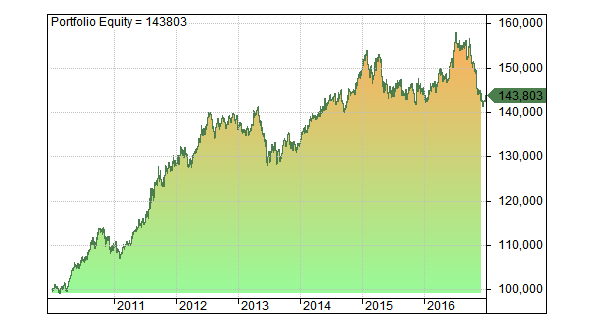
As you can see from the following equity curve, $90,000 invested in the cash part gave a steady-ish result and produced a compounded annualised return of 5.06% with a maximum drawdown of -13.80%:
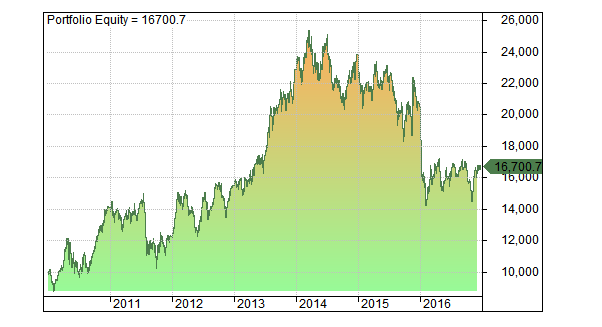
As you can see from the next equity curve, $10,000 invested in 20 random microcap stocks each year produced a lot more volatility. Over 100 runs, the simulation gave us an average annual return of 7.60% with a maximum drawdown of -43.84%:
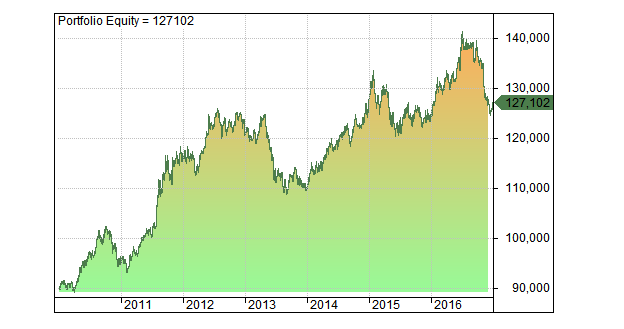
With some basic Excel and Amibroker trickery we can now combine the two strategies together to get a true picture of the Barbell trading system:
As you can see from the equity curve above, combining the two strategies together improves the smoothness of our returns. Our annualised return is now 5.33% and our maximum drawdown has dropped to -10.51%.
Initial Thoughts
You have to agree that the barbell trading strategy as presented here is slightly disappointing. While we have managed to reduce our maximum drawdown to only -11%, the annualised return is underwhelming. A buy and hold strategy on SPY returned 12.61% with an -18% drawdown over the same period.
I think a big part of the under performance here is the focus on microcap stocks. All the research I have done suggests that most microcap stocks (like most businesses) end up going nowhere. Recent academic research seems to back this up too, at least for OTC securities.
While it is conceivable to think that a few penny stocks could break through and cause lottery-type investment returns, the truth is that this rarely happens. Over 100 simulations of the microcap strategy, the worst run I encountered gave an annualised return of -3.8% while the best gave 21.93%.
If you had traded this strategy on its own, there’s a chance you would have ended up making nothing over the seven years. So, not only are the returns not very good, there is a very high deviation in the results too. And this is without even factoring in the 2008 bear market which I left out due to reconstitution issues.
Capping risk at 10% may sound like a good idea but if you lose that 10% you’ll have no option but to tap into the other 90%. The phrase ‘no such thing as a free lunch’ comes to mind here.
Including 2008
At this point I felt that it was necessary to incorporate 2008 in the results somehow but my microcap database only really goes back to 2009. So to get around this I tried another portfolio. This one holds 90% in Treasury ETFs like before and 10% in Nasdaq stocks.
The annualised return for this barbell is now 5.51% and the maximum drawdown is -12.67%. This performance is shown in the following chart represented by the orange line and compared against buy and hold SPY (in blue):
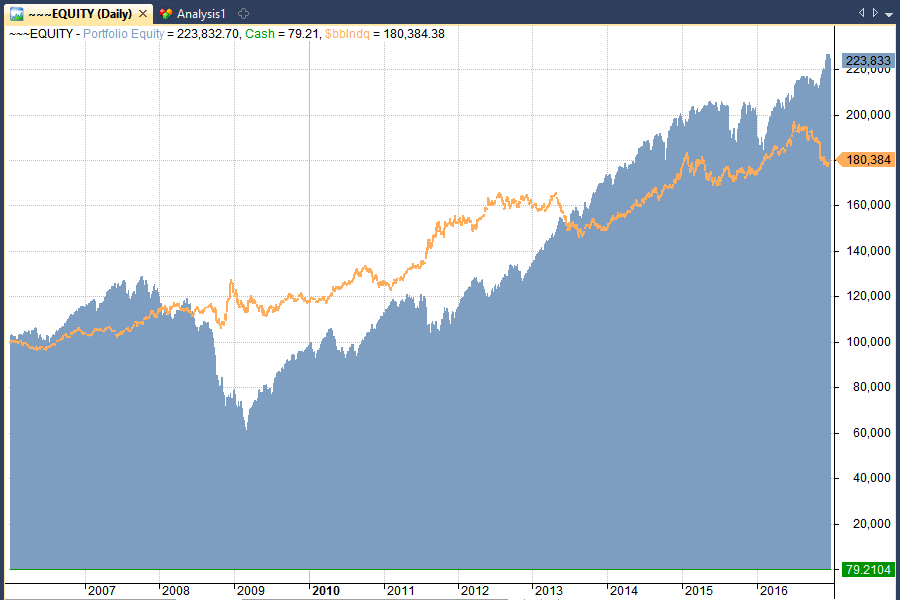
As you can see, this barbell underperformed buy and hold in terms of annualised return but it gave a much better risk-adjusted ride. CAR/MDD for the barbell is 0.44 compared to 0.14 for buy and hold.
What Next For The Barbell?
Although these results have been fairly underwhelming, I can’t help but think there are still some advantages to be had from adopting a barbell-type strategy. The idea of seeking asymmetrical returns has to be the right way to go and I still believe it is. So it could be the case that our barbell method just needs a bit of tinkering.
The first place we can start is with our initial selection of microcap stocks. After all, how realistic is it to select 20 microcaps at random?
We would surely do much better if we limited our bets to opportunities where we had good information and a lot of conviction. As the Alligator flea recommends, these trades should be kept for just a short duration. And as Taleb might suggest, we could then leverage these trades even further with margin or options.
There are surely plenty of tactics we could take so long as the essentials are taken care of. The essentials being, balancing very high risk with very low risk.
Extrapolating further, we could re-define safe to be any security where the risk of ruin is zero. As Taleb puts it:
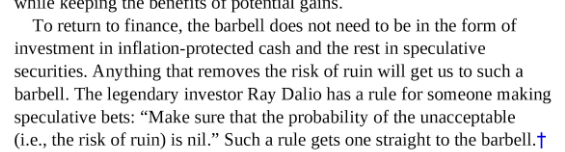
To illustrate, here is another implementation of a barbell system once again implemented in Amibroker using data from Norgate Premium.
In this example, $30,000 is held in VGLT, $30,000 is held in SPY and $30,000 is held in EEM (emerging markets). This time, our 10% risk capital is put into the 20 lowest volatility Russell microcap stocks from the previous year using ATRP.
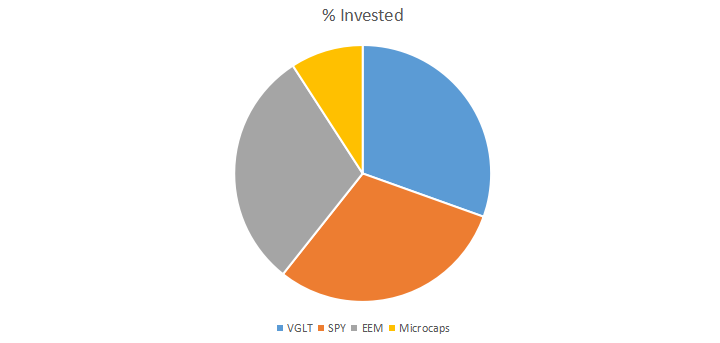
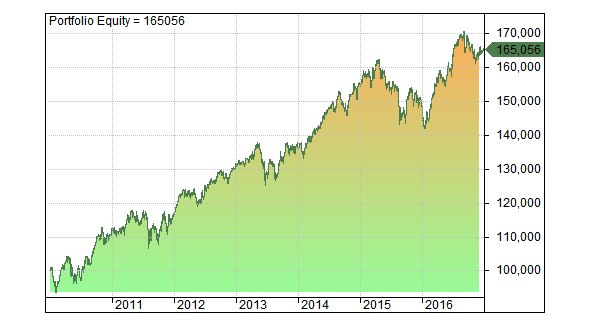
Rebalanced annually and combined together we now get an annualised return of 7.42% and a maximum drawdown of -12.57%:
Barbell Trading Strategy Conclusions
Although our final equity curve shows more promise for a barbell type trading strategy, we have not been able to produce any game changing returns and I hope that this article has illustrated some of the potential downsides to this approach.
Despite the attractiveness of the concept, passive investing in microcap stocks is still very much a gamble with no promise of return even with limited risk of 10%. The key word here could well be ‘passive’.
The best way to implement the barbell, therefore, might be to take a non-passive, short-term approach for the risky side. Take high-risk bets when the odds line up and when the portfolio is adequately balanced in safer instruments, just like the Alligator flea.
Simulations in this article made with Amibroker using data from Norgate Premium.
Rather than using small-cap stocks, an alternative would be deep out of the money options on indices (e.g SPX puts or VIX calls). The chosen contract duration might affect the results and you would need some rules about when to cash in your long-shot bets if they work out.
I would also observe that although the results you describe are not that great from a speculator’s perspective (i.e only single digit returns) for a money manager who needs to generate some growth but in a relatively low risk manner where 90% of the capital is more or less secure, 5%+ isn’t bad (especially compared with putting it all in short-dated bonds currently).
There’s still the issue of what happens if you use up your 10% ‘risk capital’ allocation with this method (as you indicate with your examples). I think you might need to reduce the return still further by only deploying half of it at any one time (i.e. 5%) to offer some protection against needing to tap the 90%. If the drawdown exceeds 10% of the total capital, it’s pretty much game over for this strategy, imo.
Hi Ralph
I completely agree, 5% is not bad when you consider the level of risk involved. Great comment.
Hi JB,
This post outlines something roughly similar to the method discussed in your article, except it refers to using riskier VIX trading strategies and allocating using a 90/10 low/high risk ratio:
Good article. Thanks for the link
Great post and data research. Keep up the great work 🙂
Thanks Alex, glad you enjoyed the article!
Hello Ralph,
How do you combine two strategies to check the equity curve in Amibroker?
Tks,
Tiago
Will write an article about this soon
Please see combine equity post.
Thank you