In this article I look at some of my favourite intraday trading patterns including naked price action patterns and Japanese Candlestick patterns.
Introduction
Not so long ago I had the pleasure of meeting some fellow intraday traders whilst on a trip around Northern Thailand. It’s not often you meet people with an interest in trading, especially when you’re thousands of miles from home and in a relatively remote place.
But what intrigued me most about this meeting was that both traders were completely chart focused. Unlike myself and most traders I know, they ignored everything except for a couple of intraday chart patterns.
To be honest, I used to think that trading completely off the chart was a bad idea. I was always taught to look at other factors as well, particularly volume and news events such as economic releases.
But meeting these two traders has given me pause for thought. Perhaps all you need are a few intraday trading patterns and a safe money management system and you’re good to go…
Or perhaps not…
Despite what I’ve just said I still don’t feel completely comfortable with trading straight off a naked price chart. That’s why I still recommend you combine your chart trading with volume or news and I recommend you limit your intraday trading to certain times of the day.
In my view, there’s no point trading when the markets are quiet. The best opportunities can be found during the busy periods such as at the open and the close as this is when traders are looking at their charts and when the most volume is moving through.
Also, always keep in mind each pattern in the context of the longer-term trend and the outlook on different market timeframes.
My favourite intraday trading patterns
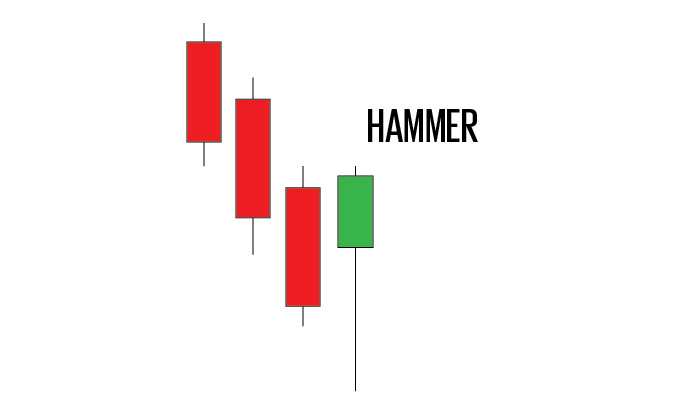
#1. Hammer
The hammer is a candlestick pattern that forms during a downtrend and it’s a good signal that the market may be about to reverse.
Typically, the hammer is a bottoming formation. It reveals that sellers have come in to take the market lower but the market has been unable to sustain those lows and bulls have managed to take the market higher to the close of the bar. The implication is that the market will start to reverse.
Key points:
• The larger the hammer (compared to the preceding downtrend bars) the stronger the signal.
• The longer the downward wick, the stronger the signal.
• Look to trade the hammer during busy market periods such as the first hour of trading.
• Can be used on anything from a 5-minute to a daily chart.
• Volume on the bar of the hammer should be larger than the preceding bars. This is evidence that buyers are overcoming sellers.
• If the hammer occurs on a major news release it’s another good sign of reversal. Price will often carry on in the new direction.
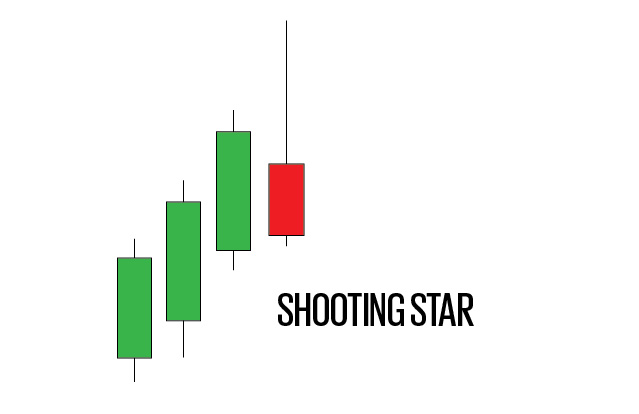
#2. Shooting Star
The shooting star is essentially the opposite of the hammer. It occurs in an uptrend and reveals how buyers have taken the market higher but eventually been overcome by the bears.
Both the hammer and shooting star are powerful candlestick patterns that can signal the beginning of new trends in intraday charts. They are especially powerful if accompanied by volume, news, or another technical indicator such as a pivot point, resistance/support line or moving average.
#3. Breakout
It’s common knowledge that markets can hit explosive trends and breakouts are a very simple method for getting on board those moves.
To buy or sell a breakout is simple, you just need to buy or sell the security as it makes a new high or low. However, as every breakout trader knows, there is also the chance of a false breakout which can lead to sharp losses.
Follow these key points to get the most of your breakout trades:
Key points:
• Breakouts in the same direction as the longer-term trend are best intraday.
• Breakouts based on fundamental news flow or events are the strongest.
• Breakouts on heavy volume (heavier than previous price bars) are best.
• Breakouts during quiet periods (such as before the open, after the close, late morning and early afternoon) are much more susceptible to whipsaws. Avoid these breakouts usually.
• Try and get on the breakout early. If you miss a strong breakout, wait for a decent pullback before getting in.
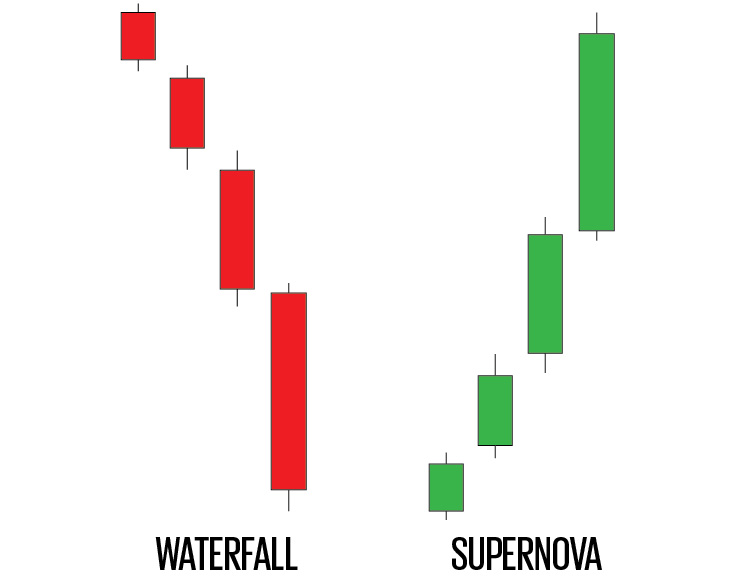
#4. Supernova/Waterfall pattern
The supernova or waterfall pattern occurs after a very powerful intraday move to the upside or downside and is often accompanied by a fundamental news release or event.
This pattern is characterised by an exponential type move where each bar is stronger than the last. On the price chart it looks as though the market can’t possibly go any higher or lower.
These moves can be hard to trade but no market can go up forever so when this pattern occurs there will normally be a sharp reversal relatively soon. This will normally be caused by traders taking their profits, thus there is bound to be some sort of reversal at some point.
Key points:
• Never short a supernova pattern or buy a waterfall pattern without some type of confirmation. For example, wait for a doji candle or inside bar before entering the trade. Traders will be looking for similar signals to take their profits.
• These patterns are best used on timeframes from 15-minutes and up.
• These patterns can occur at the beginning of new trends so don’t look for too much profit. Take a few points as the market could carry on in the same direction after it takes a breather.
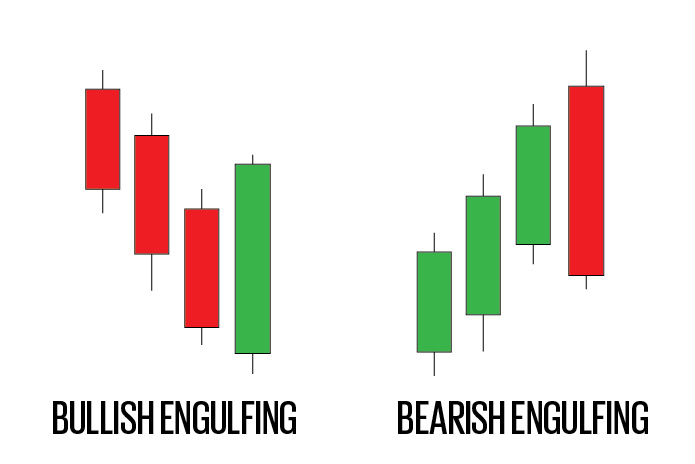
#5. Bullish/Bearish Engulfing pattern
The bullish and bearish engulfing pattern is another Japanese candlestick pattern that is a powerful market indicator in the context of an intraday or short-term trading chart.
A bullish engulfing pattern occurs when a red down candle (with a short wick) is immediately followed by a larger green candle (also with short wick) that completely engulfs the previous red candle. The bearish engulfing pattern is the exact opposite in that the smaller green candle is engulfed by a larger red candle.
These engulfing patterns suggest the continuation or beginning of a new trend in the direction of the engulfing candle. As such they show that one side of the market is overpowering the other. Again, these are most powerful when combined with heavy volume or fundamental news flow that is consistent with the direction of the move.
Key points:
• Look for engulfing patterns within the context of the overall trend and other timeframes. (In other words look to short bearish engulfing patterns if the longer-term trend is down and look to buy bullish engulfing patterns if the longer-term trend is up).
• Volume should be heavier on the engulfing candle to be significant.
• Look for engulfing patterns during busy market periods.
#6. Trend lines/ Triangle patterns
Trend lines should be drawn to connect at least two higher lows or two lower highs to signal an uptrend or downtrend respectively.
The best way to use trend lines is within the context of the longer-term trend. In other words, if you’ve drawn a significant trend line on the daily chart and the market touches that trend line on the 15-minute chart, that’s going to be an excellent opportunity to take the trade in the direction of the trend.
Triangle patterns are also useful when drawn over the daily chart. If you draw a triangle pattern and the market breaks through the wedge on a short-term time frame (such as a 15-minute chart) you’re going to be one of the first to capitalise on that longer-term breakout, by taking the short-term trade.
Key points:
• Look to enter short-term trades when the market touches or breaks your longer-term trend lines.
• Wait for confirmation that the market has found support on the trend line before entering the market.
• Observe the reaction of price across different time-frames.
• Always trade in the direction of the long term trend.
Rounding up
There are many more intraday patterns out there but in my opinion you only need one or two simple patterns to get started.
The truth to trading intraday is that you need a good broker and plenty of screen time under your belt.
These are my favourite patterns but the reality is that I hardly ever have to seek them out.
I have observed so many price charts over the years that it is very easy to spot these reversal patterns. The hardest part is having the confidence to trade on the right side of the trend (even when the market looks like it’s gone too far) and making sure to cut losers short and letting the winners run on.
In a future post, I will take some of these patterns and see how they perform on historical data. But for now, let me know what your favourite trading patterns are or if you use any at all…
THANKS ,for sharing your knowledge . Appreciated.
No problem.
Is same day chart data enough for pattern finding for intraday trading ? Or we need previous months years ood data too ?