Recently I have been re-reading the book Quantitative Technical Analysis by Dr. Howard Bandy. This is a hefty book filled with quality information and important ideas on the topic of system development.
 When I first got the book I may have been a bit overwhelmed by all the information, particularly the sections devoted to machine learning and using python. However, it is worth spending some time with this book in order to extract out all of the good stuff.
Testing The RSI Model In Quantitative Technical Analysis
Of particular interest in the book is the section on model development and Dr. Howard Bandy provides a number of working trading systems written in Amibroker AFL.
A number of the trading systems are based on standard technical indicators like the RSI.
The RSI model system originally appeared in Bandy’s other book Mean Reversion Trading Systems. I originally tested the system on my own machine and received some great results so I thought I would revisit the system and share some findings in this article.
RSI Model
Dr Bandy’s RSI Model is a classic mean reversion strategy that seeks to buy a security low and sell high with a short-term holding period.
The system is unique in that it uses lambda in order to exploit non-integer lookback lengths. This allows a lookback length that is not determined by the number of bars or days.
In the book, Dr. Bandy shows some promising results for the system when optimised in-sample including a win rate of 72% and an average gain per trade of 0.75%. Furthermore, the system was shown to be profitable in 432 of S&P 500 tickers.
This was acheived with values shown in the book as 0.47 for lambda, 16 for RSI buy level and 40 for RSI sell increment.
Walk-Forward Results
The book also shows some promising results in walk-forward tests. The optimisation of lambda and the RSI buy and sell levels attempts to keep the system in sync with the market as we move it through different out-of-sample windows.
For example, a walk-forward test on the ticker XLF (shown in the book) produced an average profit of 0.89% per trade over 10 years with an average holding period of 6 bars and a smooth equity curve.
I tested the system on a number of different tickers and also achieved good results.
In each test lambda values were optimised between 0.4 and 0.8 in increments of 0.01, the RSI buy level was optimised between 1 and 99 in increments of 1 and the RSI sell increment was optimised between 0 and 40 in increments of 1.
The system was optimised to find the best parameters over one year and then moved forward to test the same parameters on the proceeding year (out-of-sample). This process was repeated between 2003 and 2016.
By concatenating the walk-forward results together (year by year) we can get an idea of how the system has performed out-of-sample.
This is automatically calculated in Amibroker and can be viewed via the Report Explorer as one equity curve. This is one of the huge benefits of using Amibroker as walk-forward analysis is very simple.
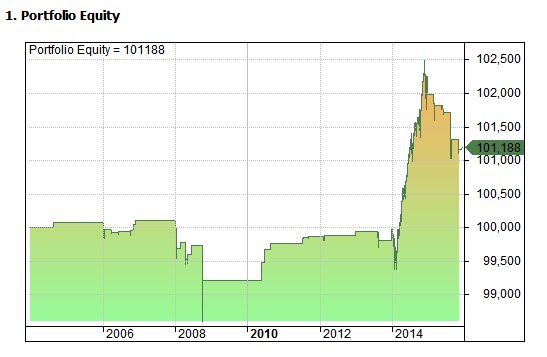
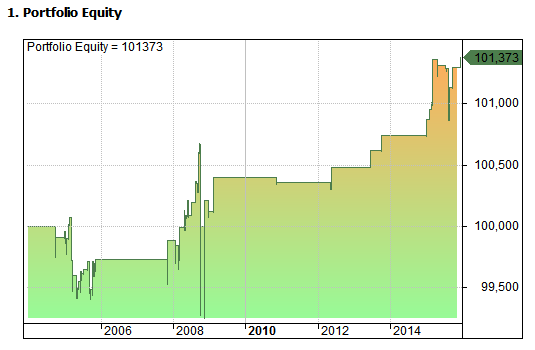
RSI Model On Pepsico $PEP
Running a walk-forward of the RSI model on Pepsico Inc. between 2003 and 2016 gave an average profit of 0.3% per trade in the out-of-sample. 67.5% of trades were winners and the average trade length was 8.75 bars.
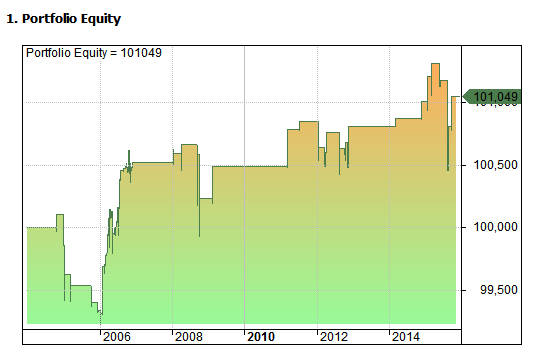
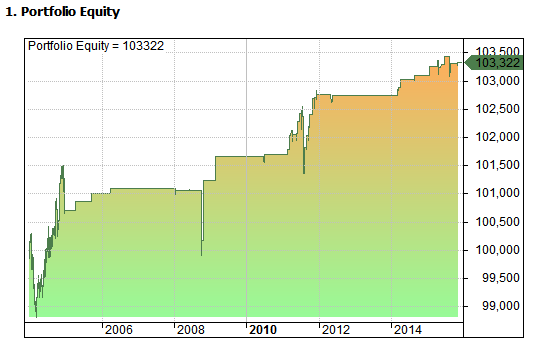
RSI Model On Verizon $VZ
Running a walk-forward of the RSI model on Verizon Inc. between 2003 and 2016 gave an average profit of 0.18% per trade in the out-of-sample. 67.2% of trades were winners and the average trade length was 3.28 bars.
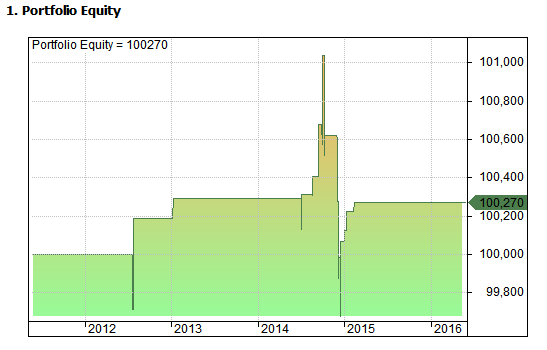
RSI Model On Tesla $TSLA
Running a walk-forward of the RSI model on Tesla Inc. between 6/2010 and 6/2016 gave an average profit of 0.22% per trade in the out-of-sample. 83.33% of trades were winners and the average trade length was 2.83 bars.
RSI Model On Astrazeneca plc $AZN
Running a walk-forward of the RSI model on Astrazeneca plc. between 2003 and 2016 gave an average profit of 0.29% per trade in the out-of-sample walk forward. 62.5% of trades were winners and the average trade length was 3.15 bars.
RSI Model On Lockheed Martin Corp $LMT
Running a walk-forward of the RSI model on Lockheed Martin Corp. between 2003 and 2016 gave an average profit of 0.60% per trade in the out-of-sample. 78.2% of trades were winners and the average trade length was 6.58 bars.
Final Thoughts
In this short article we have run the RSI model as described in Quantitative Technical Analysis by Dr. Howard Bandy. It’s clear that this is a decent system that benefits from a short holding period and a high win rate.
We tested the system on a number of different tickers and found some promising results consistent with what was shown in the book. The results are also consistent with my previous analysis and they also extend past the publication date of the book which gives us extra confidence.
Tests in this article were produced in Amibroker using data from Norgate Premium. Commissions were set at $0.005 per share.
Thanks for sharing your results Joe. Definitely looks like a pretty high win rate on a consistent basis. As long as the average loss isn’t too big this looks like it could be a neat trading system use or build-on. Thanks again!
You should try backtesting and optimising an equity portfolio using Bandy’s algorithms. I have added preselection so that only ten positions are active at any one time. Using the a backtesting engine I have written in C# which has a genetic optimiser, I get excellent results using the walk-forward sample!
Very interesting, thanks. I did start out with a portfolio but it was taking too long to optimise all the parameters. How do you approach issue selection?