The VWAP trading strategy is an increasingly common trading strategy among day traders. Some intraday stock traders say that if they could choose only one technical indicator it would be the VWAP indicator.
VWAP is not necessarily a holy grail but it is a useful indicator. Plus, many institutional traders use this indicator to break up big trades across the trading day. Also, traders disagree with the best way to use it. In the rest of this article, I test two very simple VWAP trading strategies and present the results.
What is VWAP?
VWAP stands for volume weighted average price and it gives an idea for the average price that investors have paid for a stock over the trading day.It therefore gives an idea for how various investors are positioned.
Another reason for its popularity is that it’s often used by algos and institutional traders to scale into positions. Using a VWAP trading strategy, an algo can break up it’s position size into blocks so as to minimize its influence on the market.
Although investors naturally trade with different motives and timeframes the logic of how VWAP is used can lead to various types of trading systems.
How To Calculate VWAP
To calculate VWAP you take the average price of the stock, add the volume then divide by cumulative volume over the same period.
For example, if you want to caluclate the VWAP line over a 10-minute time frame (10-minute chart) you follow the following steps:
- Take the average price that the stock traded at over the 10-minute period and add the volume that was traded.
- Divide this by cumulative amount of volume so far traded.
For example, if the average stock price over the last 10 minutes is $25 and the volume is 1000 then you get:
25 * 1000 = 25,000
You have to keep a running total of the Volume as you progress through the day to get the cumulative volume. You then divide the 25,000 above by the cumulative volume. This shows how the current price and volume relates to the amount of volume so far traded. So if the cumulative volume is so far 8,000 we get a VWAP value of 3.125
25,000 / 8,000 = 3.125.
The value of VWAP (here 3.125) doesn’t mean much on its own. The trick is to watch out the indicator develops over the course of the day and to compare it to prior days and prior periods. The indicator can then be used in a mean reversion or momentum pattern.
A comparatively low VWAP indicates lower demand and therefore the price could be about to reverse back to where larger volumes of trades are settling. However, a low or sharp change in VWAP could occur during a breakout move. In this case price will shoot forward and the VWAP will eventually catch up.
1. Buy When Price Moves Above VWAP
Our first VWAP trading strategy is momentum based. According to some traders, the best time to buy a stock is when price crosses above VWAP. This is because it shows that buyers are in control.
If price is above VWAP then it could be said that the majority of intraday positions are in profit whereas if price is below VWAP it suggests that investors are likely losing money on their trades.
I wanted to test this out. So, the following strategy goes long when price crosses above VWAP on the 15-minute chart and sells when price crosses under VWAP. All entries and exits are made on the next bar open following the VWAP signal.
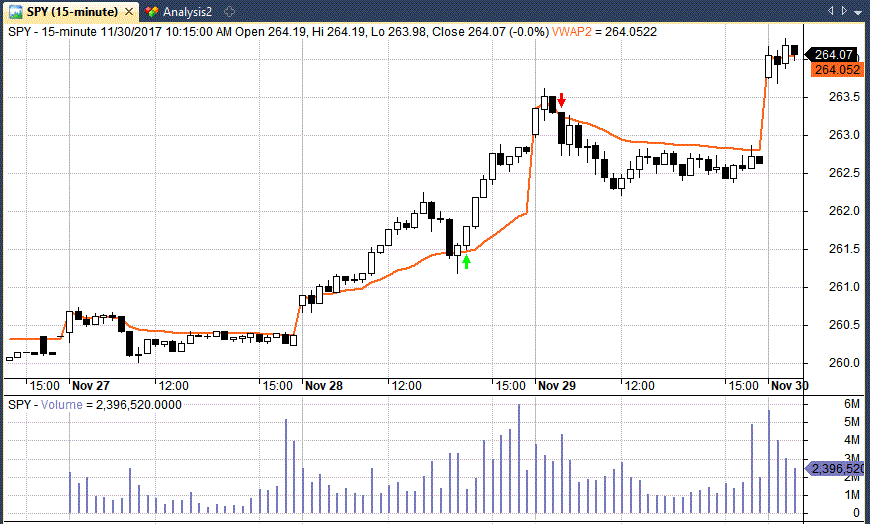
Following is an example of the trade we are looking for in SPY:
You can see SPY closes above the VWAP at 14:00 on Nov 28 so we go long on the next bar open at 14:15 (green arrow).
SPY closes below VWAP at 10 AM the next morning so we close our position on the next bar at 10:15 (red arrow). This gives us a 0.67% profit.
VWAP Trading Strategy Results On SPY
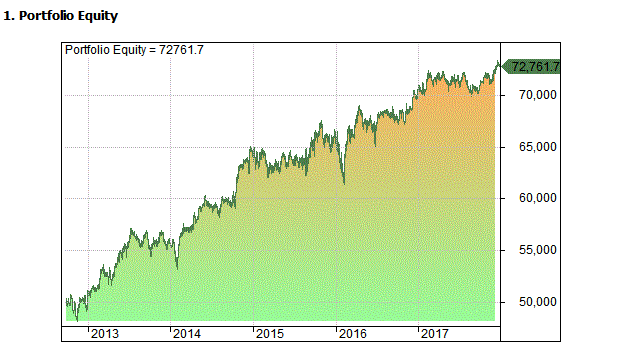
Applying this VWAP trading system on SPY between 9/2012 – 1/2018 we get the following results:
- Net Profit (on $50k): $22,761.70
- Annualized Return (CAR): 7.39%
- Max Drawdown (MDD): -9.09%
- CAR/MDD: 0.81
- # Trades: 2598
- Win Rate: 27.33%
You can see that the strategy was profitable on SPY giving a total net profit of $22,762 from a sample of 2598 trades.
The compounded annual return is not particularly good but the maximum drawdown is small and so the CAR/MDD of 0.81 is decent. The win rate is particularly low at only 27%.
It should be mentioned that performance is also degraded by the inclusion of transaction costs, set at $0.005 per share.
2. Buy Below VWAP
Some traders use VWAP in the reverse way and look to buy below VWAP. In other words they wait for a stock to drop below the VWAP line.
These traders see the VWAP indicator as a guide to value. When a stock trades below VWAP then it indicates good value and should be bought.
The following strategy, therefore, goes long when price crosses below VWAP on the 5-minute chart and it sells when price crosses back above VWAP.
Since there are many algorithms that use VWAP to scale in trades this seems like it could be a solid trading idea. Let’s test it out.
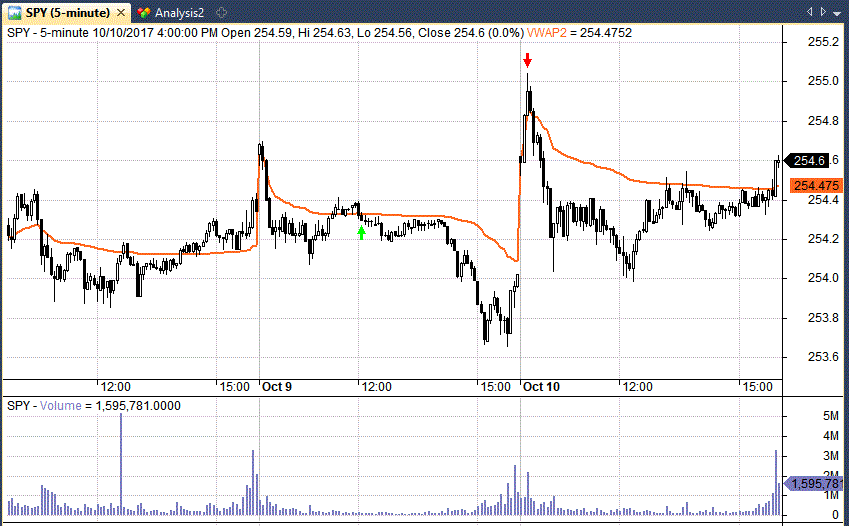
Following is an example of the trade setup:
SPY closes below VWAP on the 5-minute chart at 12:00 so we go long the next open at 12:05. We don’t exit the trade until the next morning at 09:40. We suffer an intraday drawdown but end in a decent profit.
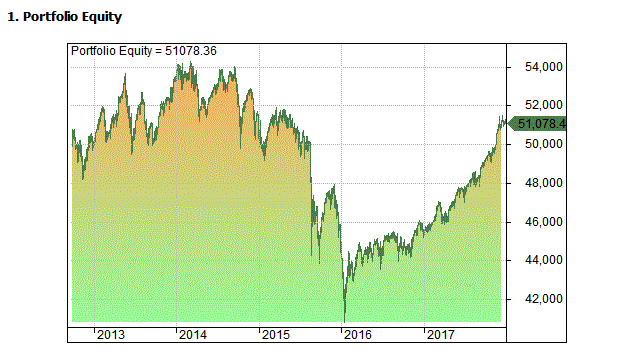
Backtesting this strategy on SPY between 9/2012 – 1/2018 gives the following result:
- Net Profit (on $50k): $1,078.36
- CAR: 0.41%
- MDD: -24.79%
- CAR/MDD: 0.02
- # Trades: 2599
- Win Rate: 79.57%
What is interesting about these results is that we have recorded a much higher win rate (almost 80%) yet we have a much worse result and an unattractive looking equity curve.
So far it seems that a VWAP strategy works better for momentum than for mean reversion.
VWAP Backtest Results For 20 Nasdaq Stocks
So far we have seen some mixed results when trading SPY intraday using a VWAP trading strategy. How does the indicator get on when trading other tickers?
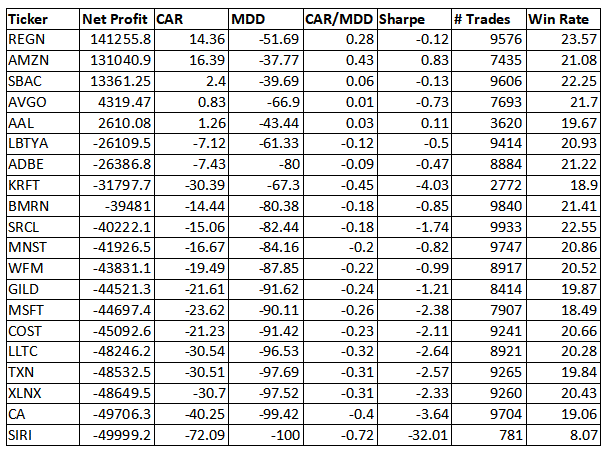
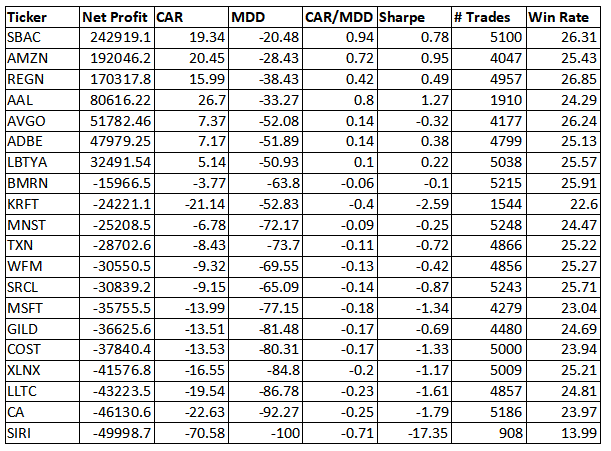
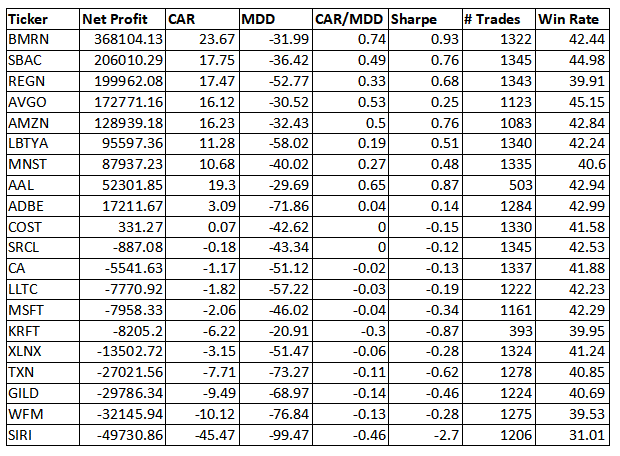
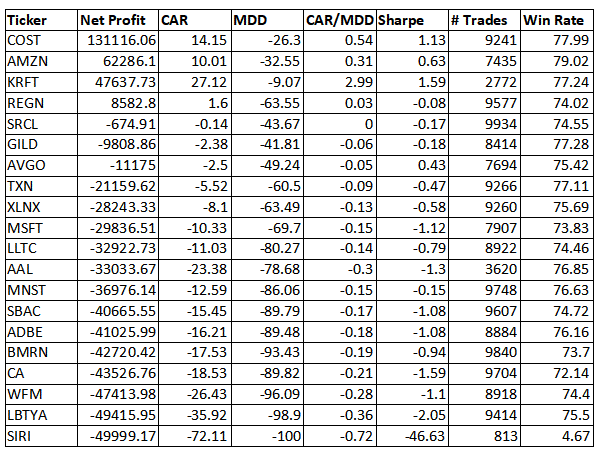
To find out, I picked 20 Nasdaq stocks at random and applied the two strategies above to each one.
This time, I extended the data period – 1/2008 – 1/2018 and I tested three different time frames; the 5-minute chart, 15-minute chart and the 2-hour chart.
Following you will find summaries of the results:
Results – Strategy 1 (Buy When Price Moves Above VWAP)
5-minute
15-minute
2-hour
Results – Strategy 2 (Buy When Price Moves Below VWAP)
5-minute
15-minute
2-hour
Observations
So what can we make of these VWAP backtest results?
Well, it’s clear that the VWAP indicator is not a holy grail. But it is capable of some good results.
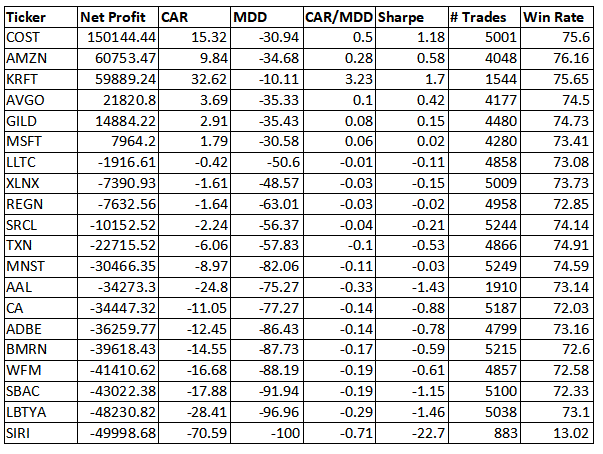
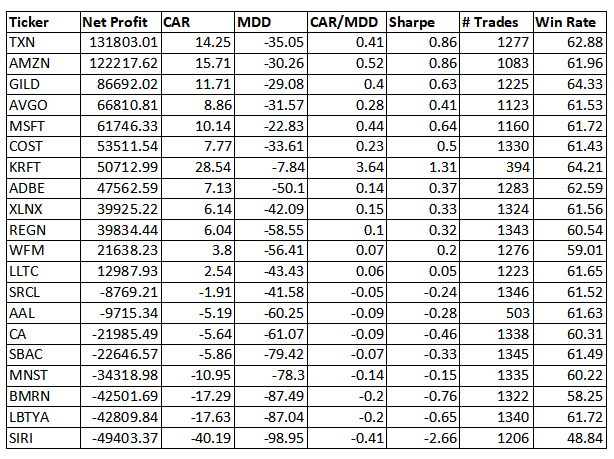
Using a VWAP trading strategy to trade momentum worked great for Amazon giving us a 20.45% annualised return on the 15-minute chart despite only a quarter of trades being winners.
It worked even better on the 2-hour chart with half of the 20 stocks showing a profit.
Conversely, using the VWAP indicator for mean reversion worked well for KRFT giving an annualised return of 33% on the 15-minute chart with minimum drawdown. But only six stocks were profitable on this timeframe.
Best Time Frame For VWAP
Overall, it seems that momentum works best for VWAP and the longer 2-hour chart has the best results.
Interestingly, you will find that most intraday stock traders are looking at much lower time frames than that. The superiors results here are surely a reflection of the impact of transactions costs on shorter time frames.
So, using the VWAP indicator to trade momentum on the 2-hour chart worked best. But it must be said that none of the strategies were consistently profitable. Several of the stocks tested sustained deep losses.
VWAP scalping strategies also showed little sign of profitably. The best results came with 2-hour charts or more. However, if you have broker with very low transaction costs this finding could change.
Final Thoughts On The VWAP Indicator
VWAP is a very popular indicator among stock traders and you can understand why. It is an intuitive indicator and forms the basis of many execution strategies.
However, research online reveals that intraday stock traders disagree on the best way to use it.
This suggests that the VWAP indicator is not a holy grail and can be used in different ways depending on the market, the time frame and the trend.
Our results reveal a similar conclusion. A VWAP trading strategy can result in strong profits but much depends on the symbol and whether the market is trending or ranging.
It’s also worth mentioning that transaction costs, as with any intraday strategy, play a large role in expected returns.
Clearly, there are many other ways to incorporate VWAP into a trading strategy. I am looking at several ideas and not found anything conclusive yet.
What this analysis does show is that it is unwise to jump into a VWAP trading strategy that you read about online until you have fully understood the dynamics and expectancy of the system (or lack of!).
Using VWAP on longer term charts works better because it reduces the impact of costs.
Notes: Simulations and charts from Amibroker using intraday data from DTN IQ Feed. Results include transaction costs of $0.005 per share each side.

Interested in knowing NEW TRADING SYSTEM.
I think the conclusions of your analysis have very limited power, based on the fact that you choose a long only strategy, in a stretch of time where shares went basically vertically up…
You should test a long/short strategy, and backtest on different timestretches (a bull period, a bear perior, a flat period), this way your results actually would mean something.
Yes it would be beneficial to run that type of analysis. I did look at the short side in private testing and it wasn’t good so I didn’t go further with it. Also, it’s slightly untrue to say that all these stocks were in a bull market. Some of these individual names were not in up trend the whole time.
Can’t wait to try the new indicator. Hope to help in my trading.
hi sir cant download this Afl?