Every major trend in history has begun with a breakout.
However, breakouts also lead to whipsaw trades so it’s sometimes better to join a trend on a subsequent pullback.
In the rest of this article I will demonstrate a very simple strategy that does just that.
This is a long only, daily strategy that shows good results on several stocks and ETFs.
Unlike other trend following strategies, we are able to get good results with a high win rate and short trade duration.
Pullback Strategy Rules
The idea of this strategy is to always trade short-term pullbacks within the longer term trend.
For the longer term trend we will use the 200-day moving average and for the the short-term trend we will use the 10-day moving average.
The full rules can be described as follows:
Buy Rules
- Close > 200-Day MA
- AND Close < 10-Day MA
Sell Rules
- Close > 10-Day MA
- OR By 10% Stop Loss
Additional Backtest Settings
- Starting Capital: $50,000
- Position Size: 100% (compounding allowed)
- Execution: All trades (including stops) entered on next day open
- Transaction costs: $0.005 per share
- Margin: None
So you can see this is a very simple strategy.
When a stock pulls back below its 10-day MA but trades above its 200-day MA we go long on the next open. We then sell after a close above the 10-day MA or by 10% stop loss.
All trades are placed on the next bar open following the trading signal.
Example Trade Setup
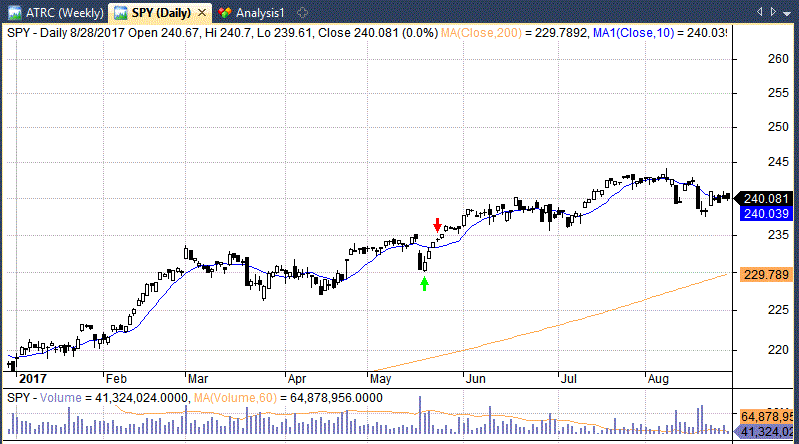
Following is a clear example of the trade setup we are looking for in SPY:
You can see that on the 17th May 2017, SPY closes well below the 10-day MA (blue) but above the 200-day MA (orange) indicating that the longer term trend is still intact.
We therefore go long on the next open with our full position size (green arrow).
We then see a rally and on the 22nd May, SPY closes back above the 10-day MA so we exit our position on the next day open (red arrow) for a profit of 1.79% before fees.
Backtest Results
Now we know the rules to this pullback strategy we can backtest on historical data to see how the strategy has performed over time.
To do this I will first test the system on an in-sample period between 1/1995 to 1/2010 and then later on an out-of-sample period between 1/2010 – 1/2018.
I will be using the backtesting software Amibroker with historical data from Norgate.
In-Sample Results
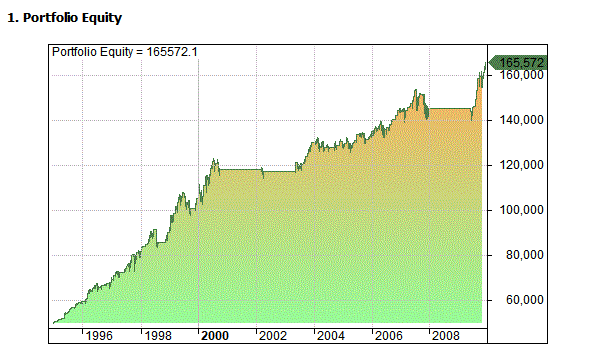
This system was first tested on SPY daily data between 1/1995 to 1/2010 and produced the following statistics and equity curve:
- Net Profit: $115,572.08
- CAR: 8.31%
- MDD: -9.43%
- CAR/MDD: 0.88
- # Trades: 229
- Win Rate: 76.86%
- Avg Bars Held: 5.27
- Avg P/L Per Trade: 0.53%
- RAR: 32.11%
Out-Of-Sample Results
I then tested the system on out-of-sample data between 1/2010 to 1/2018:
- Net Profit: $31,524.72
- CAR: 6.31%
- MDD: -12.41%
- CAR/MDD: 0.51
- # Trades: 163
- Win Rate: 72.39%
- Avg Bars Held: 4.55
- Avg P/L Per Trade: 0.31%
- RAR: 21.85%
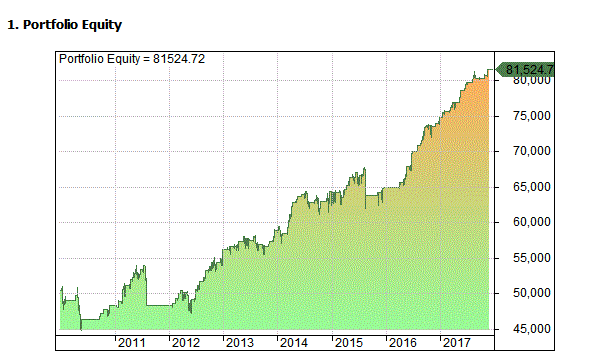
You can see that our out-of-sample results are decent and fairly consistent with our in-sample results. We have a nice win rate of over 70%.
Full Sample Results
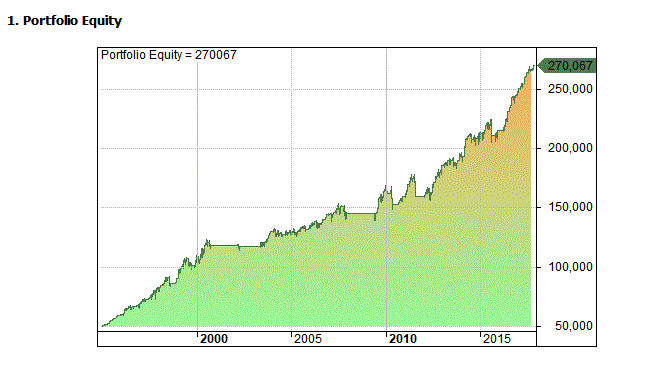
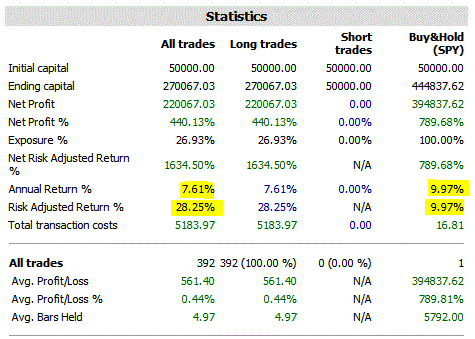
Following you can see an equity curve for the full sample period between 1/1995 / 1/2018 and a comparison against buy and hold:
You can see that we have achieved a strong risk-adjusted return of 28.25%. We also have a smooth equity curve with none of the -57% drawdown that was experienced in 2008 in SPY.
Walk-Forward Results
In order to reduce the impact of curve fitting we can also utilize the technique of walk-forward analysis and this pullback strategy is perfectly suited for this due to the easily adjustable parameters.
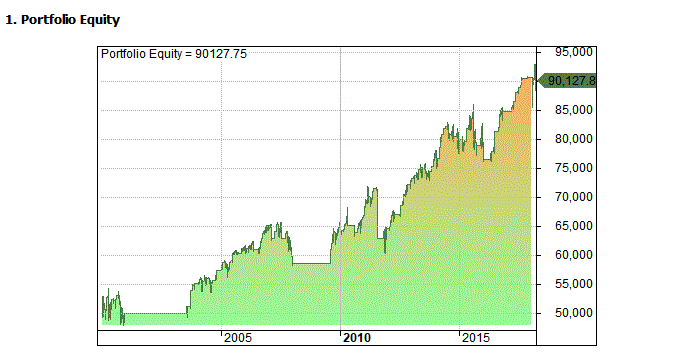
Following you will see the results for a walk-forward optimization in Amibroker.
The fast MA, slow MA and stop loss length have been optimized with in-sample steps of 5 years and OOS step of 3 months. Net Profit is used as the objective function:
Amibroker Code Snippet
Following is a code snipped that can be used in Amibroker:
MA1 = Optimize("M1",200,50,300,25);

MA2 = Optimize("M2",10,5,50,5);

ST1 = Optimize("S1",10,2,20,2);

LongTermTrendUp = C>MA(C,MA1);

Pullback = C<MA(C,MA2);

Exit = C>MA(C,MA2);

BUY = LongTermTrendUp AND Pullback;

SELL = Exit;

ApplyStop(stopTypeLoss,stopModePercent,ST1,2);
Final Thoughts
This is a very simple strategy for trading pullbacks within the longer term trend.
It shows good risk-adjusted returns on SPY in out-of-sample testing with low drawdown. I also found good results on other stocks and large ETFs suggesting this system could be applied to a wide range of markets.
To enhance returns further, this system might well be implemented with margin, for futures, or on a leveraged ETF like SPXL.
It may also be a good idea to introduce a short side.
One of the main advantages of this system in my view is that it can be easily optimized with a walk forward analysis and applied to other securities.
This is also a good, simple strategy to use if you have an opinion on the overall trend of the market.
For example, if your view is that stocks or bonds or gold are going up, use this strategy as an uncomplicated way to take chunks out of the trend!
Simulation and charts in this article from Amibroker using data from Norgate Data.

Hi Joe
Does this system require you to put 100% of trading capital on the line each time you make a trade?
Correct
In that first chart with the green and red arrow, there are seemingly ~30 other buy signals that could’ve been triggered as well, but you chose to highlight just that one. Why is that? Many of these other signals would’ve led to some choppy losses. What am I missing?
You are not missing anything. There are indeed other signals (not so many as 30) which would have caused a loss. The system traded them all (except if the previous trade had not exited yet). But it still ended in profit overall. I always highlight a trade example that is profitable to show the type of ideal trade setup we are looking for in the trade.
Nice! Does it make sense to optimize the parameters? For example maybe using 190day MA and 9 day MA, with 8.2% stop loss results in max gain? Or was the 200MA/10MA/10% stop loss determined using the 1995-2010 “in sample data”?
The parameters were not optimized for maximum gain. I don’t like to optimize too much as you get curve fitting. If you want to optimize I would prefer to use a walk forward method with adequate sample size for each in-sample window.
Hi Joe…Me again, Ron D here in AZ. You were going to get back to me on a system I sent you a couple months ago, but you never did? Anyway, I would urge you to run your above strategy once again, using not an SMA 10, but a HULL HMA 21 instead. You will not believe the difference in your results. Also, I put a 10% trailing stop on the trade, and then, when the HMA 21 turns from green to red, I exit the trade on that day. I think you will like the results….same Ron D
Yes I’m sorry, things have been very hectic recently. I’m still hoping to run it.
Thanks for the tip on Hull I will check it. Regards.