
This post contains a detailed guide for creating a mean reversion trading strategy.
You will learn what mean reversion is, how to trade it, 10 steps for building a system and a complete example of a mean reversion system for US stocks.
Introduction To Mean Reversion
A mean reversion trading strategy involves betting that prices will revert back towards the mean or average.
Markets are forever moving in and out of phases of mean reversion and momentum. Therefore it’s possible to develop strategies for both types of market.
A simplistic example of a mean reversion strategy is to buy a stock after it has had a large fall in price.
When a stock has seen a big drop, there’s usually a good chance that it will bounce back to a more normal level.
What Is Mean Reversion Trading?
The idea of mean reversion is rooted in a well known concept called regression to the mean.
This is a theory first observed by statistician Francis Galton and it explains how extreme events are usually followed by more normal events.
In other words, things tend to even out over time.
For example:
- If a soccer team scores an unusual amount of goals in a match, the next game they will probably scorer closer to their average.
- If the first person you see today is unusually tall, the next person you see will probably be shorter.
- If the Dow Jones Industrial Average drops 20% this month, it will probably fall less than that next month.
The way to apply this strategy in the market is to seek out extreme events and then bet that things will revert back to nearer the average.
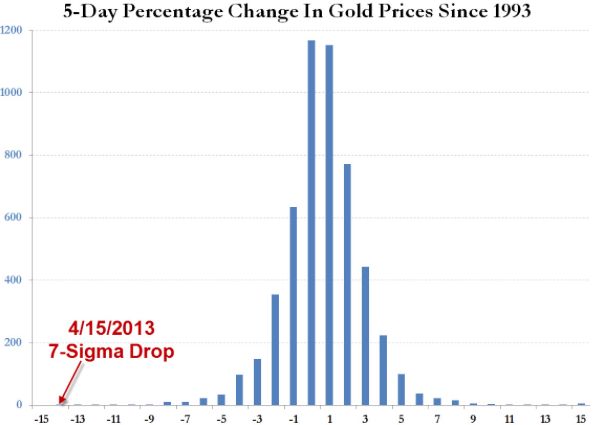
The tricky part is that financial markets are not normally distributed.
They have a long tail and extreme events can cluster together. Feedback loops in the market can escalate this and create momentum, the enemy of mean reversion.
In other words, sometimes when a stock drops 10% on a given day it drops even further the next day.
Despite this, mean reversion is a powerful concept that traders can use to find an edge and built trading strategies around.
Later on in this article I will show the process I use to build mean reversion trading systems.
Different Ways To Trade Mean Reversion
A simple mean reversion strategy would be to buy a stock after an unusually large drop in price betting that the stock rebounds to a more normal level.
However, there are numerous other ways that investors and traders apply the theory of mean reversion.
Technical Indicators
Technical indicators like RSI can be used to find extreme oversold or overbought price levels. These can act as good levels to enter and exit mean reversion trades.
Standard deviation, Bollinger Bands, Money Flow, distance from a moving average, can all be used to locate extreme or unusual price moves. A good mean reversion indicator identifies extremes in prices that are likely to be temporary, not permanent.

Financial Information/ Fundamentals
Some investors will look at financial information such as PE ratios or earnings reports.
If a company reports strong quarterly earnings way above its long term average, the next quarter it will probably report closer to its average.
There are many factors at play which can contribute to extreme results. Many of which suffer from natural mean reversion. For example, the weather.
Similarly, if a stock has an unusually low PE ratio, an investor might buy the stock betting that the company is undervalued and the PE will revert to a more average level.
Economic Indicators
Some investors will look for mean reversion in economic indicators.
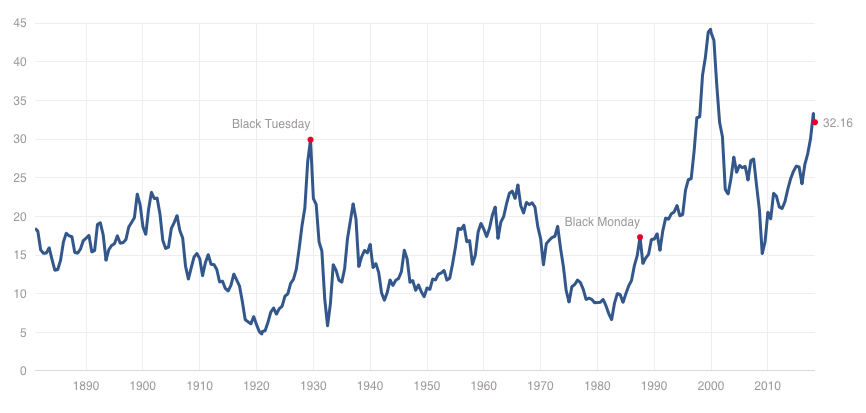
For example unemployment, GDP or Shiller’s CAPE (cyclically adjusted price to earnings).
When Shiller’s CAPE (below) is above average it indicates that stocks are historically expensive. Many investors trim their exposure to the stock market as a result.
Sentiment Indicators
Since the market is a reflection of the crowd, some investors will look at sentiment indicators like investor confidence. Mean reversion indicators like these often find good turning points.
For example, if 70% of investors are bearish, that might be a signal of too much pessimism in the market.
Historically, investor surveys have shown investors become more pessimistic near market lows and more confident near market peaks.
The chart below is the AAII Investor Sentiment Index and it shows clear mean reversion characteristics. It is plotted against the S&P 500 Index (blue):
There are peaks in investor sentiment near market highs such as in January 2000. There are also troughs near market bottoms such as March 2009 and May 2016.
Pairs Trading
Pairs trading is a fertile ground for mean reversion trades because you can bet on the spread between two similar products rather than attempting to profit from outright movement which can be riskier.
If two markets are correlated (for example gold and silver or Apple and Microsoft) and all of a sudden that correlation disappears, that can be an opportunity to bet on the correlation returning.
Let it be said that there are many other ways that you could measure mean reversion so you are limited only in your imagination.
Arguments Against Mean Reversion
So far we have looked at some ways investors approach mean reversion and how it’s grounded in a concept called regression to the mean.
However, mean reversion as applied to financial markets, does have its critics.
Markets Are Efficient Criticism
Proponents of efficient market theories like Ken French believe that markets reflect all available information.
It is therefore not possible to beat the market with a mean reversion algorithm (or any other strategy) without some form of inside information or illegal advantage.
In other words, if a stock falls 20% in a day, there is a justified reason for that drop.
The stock has fallen to price in the latest information and there is no reason why the stock should bounce back just because it had a big fall.
There is some truth to the efficient markets hypothesis. If you analyze stock prices in detail you’ll find they often exhibit properties of a random walk.
However, efficient market hypothesis also has major flaws. You only need to see the crazy moves in shares like GameStop and AMC to understand that markets are not efficient all of the time.
This imbalance is what allows mean reversion trading strategies to flourish.
Who wants to live in a world where you cannot reasonably make money on a stock because the markets are perfectly efficient? There will always be a time when you have an edge over the market. This theory simply does not hold up.
Poor Performance Criticism
There is also criticism surrounding the performance of mean reversion indicators such as Shiller’s CAPE.
CAPE has a good record of market timing over the last 100 years which is why it has become such a popular tool.
But closer inspection reveals that most of the gains came in the first first 50 years. In the most recent 50 years, the ratio has actually done worse than buy and hold.
There is an argument that some mean reversion indicators like CAPE are based on insufficient sample sizes.
A hundred or two hundred years may sound like long enough but if only a few signals are generated, the sample size may still be too small to make a solid judgement.
Illogical Strategy Criticism
One flaw with a mean reversion strategy is that in theory, the more a stock falls, the better the setup becomes. This can cause issues with risk management.
For example, imagine you buy a stock after a 10% fall.
Instead of the stock rebounding, it goes on to fall another 10% the next day.
Even though you are losing money, a mean reversion strategy will likely see the drop as another buy signal.
Mean reversion requires you to hold on to your loser or even increase your position in this scenario.
From a risk management point of view it can make more sense to cut your losses at this point. But this goes against the concept of mean reversion. This results in a logical inconsistency.
If you keep increasing your position in a stock that doesn’t rebound you will eventually blow up.
In reality, however, successful mean reversion traders know all about this issue and have developed simple rules to overcome it.
For example, they will use time based exits, fixed stop losses or techniques to scale in to trades gradually.
Arguments For Trading Mean Reversion
Despite some of the arguments against mean reversion trading strategies there are clearly many successful investors who have taken this approach and been successful.
- Jim Simons has used mean reversion type strategies through his hedge fund Renaissance Capital.
- Many of the traders profiled in Market Wizards used mean reversion type strategies. Paul Tudor Jones, for example.
- The majority of HFT firms utilise simple mean reversion strategies.
- Value investors like Warren Buffett and macro investors like Jim Rogers use contrarian type strategies not dissimilar to mean reversion.
On a personal level, I have found mean reversion algorithms provide a powerful way to trade the markets and I have developed numerous mean reversion systems over the last few years.
“Everyone says you get killed trying to pick tops and bottoms and you make all your money by playing the trend in the middle. Well, for 12 years, I have been missing the meat in the middle, but I have made a lot of money at tops and bottoms.” – Paul Tudor Jones
Building A Mean Reversion Trading Strategy In 10 Steps
Now we have talked about some background, I am going to detail more about my process for building mean reversion trading systems.
I think we can break this process down into roughly 10 steps. It all begins with getting ready the right tools for the job.
Step One – Software
An important part of building a trading strategy is to have a way to backtest your strategy on historical data.
Backtesting does not guarantee that you will find a profitable strategy but it is the best tool we have for finding strategies that work.
The first step is to get hold of a good backtesting platform and learn how to use it.
I use Amibroker which is quick and works very well for backtesting strategies on stocks and ETFs. I also use other software depending on the task at hand.
There are numerous other software programs available and each comes with its own advantages and disadvantages. You can also do plenty of analysis with Microsoft Excel.
Understanding The Software
A key part of learning how to use backtesting software involves understanding any weaknesses within the program itself that might lead to backtesting errors.
For example, how easy is it to program rules that look into the future? How easy is to analyse your results and test for robustness?
One of the deadliest mistakes a system developer can make is to program rules that rely on future data points.
A classic example is using the closing price to calculate a buy entry but actually entering the stock on the open of the bar. In other words you trade before the signal.
This is called a future leak and it can be surprisingly easy to do if you are not careful.
Generally, if your entry signal is based on the close of one bar, have the system execute its trade on the next bar along.
Step Two – Data
The next step is to get hold of some good quality data with which to backtest your strategies. If you don’t have good data, then any analysis you do is going to be flawed.
There are a number of questions to consider:
For stocks: Is the data adjusted for corporate actions, stock splits, dividends etc?
If not, the data can produce misleading backtest results and give you a false view of what really happened.
For example, a chart that has not been adjusted for a 2:1 stock split will show a 50% overnight gap when in reality there was never any gap.
If your trading system shorts this gap it will show a huge 50% profit which never happened.
In the following chart you will see how Apple underwent a 7:1 stock split in 2014:
Having data that is clean and properly adjusted for splits etc. leads to more robust trading systems and more confidence in your trading.
The inclusion of dividends can also add an extra two or three per cent to the bottom line of your strategy.
For stocks: Does the data include historical constituents?
Every year, businesses go bankrupt. Some merge with other companies. Others get moved around to different market indexes.
For example, Urban Outfitters (URBN) used to be a member of the S&P 500 but now it sits in the Mid Cap Index.
When the Dow Jones Industrial Average started it was made up of companies such as American Cotton Oil and National Lead. Not surprisingly, those stocks don’t exist anymore.
If you don’t include historical members and you run a backtest on stocks that make up a particular index you will introduce a hefty amount of survivorship-bias.
By using only the latest index constituents, your universe will be made up entirely of recent additions or stocks that have remained in the index from the start.
These tend to be the strongest performers so you will get better results than you would have in real life.
For stocks: Is your data the right frequency?
There can also be some difficulty in backtesting high frequency trading strategies with low frequency data which I have talked about previously.
This is because stock prices are an amalgamation of prices coming from multiple different exchanges. It’s best to use the right frequency data for your strategy.
If you are using end-of-day data to create intraday strategies there is a high chance of getting unrealistic results because you won’t be able to model entries and exits accurately enough.
For these intraday systems, you will need more granular data such as 1-minute data.
For stocks: Is the data point-in-time accurate?
If you are using fundamental data as part of your trading strategy then it is crucial that the data is point-in-time accurate.
In other words, you don’t want to know what the PE ratio of your stock is today, you want to know what it was when the backtest was run.
Finding accurate point-in-time data for fundamentals can be difficult.
Computerised records of fundamentals simply weren’t around twenty or thirty years ago. But there are options available from providers like Compustat and FactSet.
For futures: How is the data being reproduced?
Futures markets are comprised of individual contracts with set lifespans that end on specific delivery months.
This means there’s no one time series that accurately represents the whole history of that futures market. It’s always an amalgamation of contract months.
Some data vendors reproduce this data ‘as is’ and simply splice the contracts together.
This can be OK for intraday trading and for seeing where a futures contract traded in the past. But it means there are price gaps where contracts roll over.
Other data vendors get around this by back-adjusting the data and creating so called ‘continuous contracts’.
This produces a realistic representation of the market and is generally better for backtesting.
However, the downside to this approach is that historical price levels are not accurate.
Markets in backwardation can end up with negative prices due to the back-adjustment calculation and these prices may not be adequately shown on some charts.
For example, the back-adjusted Soybeans chart below shows negative prices between 1998 and late 2003:
System calculations such as those using multiplication and division can be thrown off by negative prices or prices that are close to zero.
Therefore, you need to be careful using these calculations in your formulas. Make sure back-adjusted prices are not giving off false signals.
For forex: Where is the data from and what does it show?
There is no centralized exchange in forex so historical data can differ between brokers. Usually the difference is small but it can still have an impact on your mean reversion forex strategy.
A general rule is to only use historical data supplied by the broker you intend to trade with. Doing so means your backtest results are more likely to match up with your live trading results.
In addition, forex quotes are often shown in different formats. Some providers show the bid, some the ask and some a mid price.
If you intend to backtest this data you need to know what you are dealing with. Otherwise your mean reversion forex strategy will fail as soon as you go live.
You can add a couple of pips of slippage to reflect the spread that you typically get from your broker. You want your backtest trades to match up with your live trades as closely as possible.
Remember that spreads can increase during important events or high volatility.
Is the data kept clean and up to date?
Maintaining a database for hundreds or thousands of stocks, futures contracts or forex markets is a difficult task and errors are bound to creep in.
It’s best to spend money on data that is being kept clean and up to date by an experienced team.
Is there enough data to make meaningful conclusions?
A lot of trading mistakes can come from not having enough data in the first place.
If you intend to backtest an end-of-day mean reversion trading strategy but only have a couple of years of data available, it’s unlikely that you will be able to make significant conclusions from that data.
There are no hard rules but ideally you want to see a good sample of trades.
For a mean reversion strategy that trades daily bars you will typically want at least eight to ten years of data covering different market cycles and trading conditions.
Bare in mind, however, that good trading strategies can still be developed with small sample sizes.
They are simply harder to prove with the typical stress testing techniques available.
Round Up
Overall, there is plenty of free data available but if you want good results it’s worth paying some money. I use Norgate Premium for end of day data and I use IQ Feed for intraday data.
Step Three – Have A Plan
Once you have organised your backtest environment, it’s time to make some decisions about what you want to test and what you hope to get out of your testing.
What you don’t want to do is run a load of haphazard simulations without knowing what you are looking for. You will get more out of the process if you have some clear aims in mind.
Some key questions to ask are:
- What markets do you want to focus on?
- What timeframes do you want to test?
- What ideas will you test?
- What kind of tests will you run?
- What parameters will you test?
- What metrics will you use to measure success?
- When will you give up on an idea?
When I sit down to do analysis, I try to focus on markets that are more suited to my trading style. I look for markets that are liquid enough to trade but not dominated by bigger players. I want to test markets that will allow me to find an edge.
In terms of timeframes I usually focus on end-of-day trading and I try to start off with a logical idea or pattern that I have observed in the live market.
I like to only test a couple of trading rules at first and I want to see a large sample of results, usually over 300 trades. My biggest concern is to avoid curve fit results and find strategies that have a possible explanation or behavioural reason for why they would work.
No matter what type of analysis I do I always reserve a small amount of out-of-sample data which I can use at a later to date to evaluate the idea on. If I have only a small amount of data then I will need to see much stronger results to compensate.
When measuring success, I always look at the equity curve and CAR/MDD ratio first.
I will always compare this to a simple benchmark like buy and hold and I like to see some consistency between in-sample and out-of-sample results.
Later I will look at metrics such as bars held, average p/l, win rate, maximum drawdown and highest number of losing trades in a row.
I know that these factors will affect me mentally when I trade the system live so I need to be comfortable with what is being shown.
When it comes to backtesting a mean reversion trading strategy, the market and the trading idea will often dictate the backtesting method I use.
If the idea is based on an observation of the market, I will often simply test on as much data as possible (reserving 20 or 30 percent of data for out-of-sample testing). This allows me to see the maximum number of trade results.
If the idea has adjustable parameters or I am only testing one single instrument, I will often use a walk-forward method. The walk-forward method will work to overcome the smaller sample of trades that comes from trading just one market.
I will often put a time limit on my testing of an idea. If I’m testing an idea for an hour and haven’t seen any positive signs I will abandon it and move on to something else. This is easier said than done though so you need to be disciplined.
Step Four – Buy And Sell Rules
For a mean reversion strategy to work, you want to find extreme events that have a high chance of seeing a reversal.
There are plenty of buy and sell rules to choose from:
Standard Deviation
Standard deviation measures dispersion in a data series so it is a good choice to use in a mean reversion strategy to find moments of extreme deviation.
To implement this effectively you can:
- Calculate the average daily returns of your intended instrument
- Organise the daily returns into regular intervals (bins)
- Plot the intervals as a histogram and calculate probability distribution
- Develop trading strategies that trade when movement is more than an average standard deviation (sigma).
Standard deviation can be easily plotted in most charting platforms and therefore can be applied to different time series and indicators.
Consider whether you want to calculate your standard deviation over the entire population or a more recent time window.
It’s important to remember that while standard deviation is useful, markets are non-stationary and not normally distributed. These means market conditions do not stay the same for long and high sigma events happen more often than would be expected.
Relative Strength Index (RSI)
One of the best technical indicators for mean reversion is RSI (Relative Strength Index) and I will often look at low values like RSI(2), RSI(3) or RSI(4).
When RSI(3) is under 15, it is often a good place to enter a mean reversion trade.
When a stock becomes extremely oversold in a short space of time short sellers will take profits. Longs will also throw in the towel or have their stops hit.
This can trigger a quick rebound in price. Profits can be taken when the indicator breaks back above 50 or 60.
Strategies based on this indicator have worked well on stocks and ETFs in the past.
Bollinger Bands
Bollinger Bands plot a standard deviation away from a moving average. A close under the bottom Bollinger Band or above the top Bollinger Band can be an extreme movement and therefore a good opportunity to go the other way.
%B which I first learnt from Connors Research helps to quantify the distance between price and the upper or lower band.
When %B is above 1, price is above the upper band and when %B is below 0, price is below the lower band.
%B = (Price - Lower Band) / (Upper Band - Lower Band)
Internal Bar Range
This indicator plots the closing price of the stock in relation to its daily trading range.
A value more than 0.5 means the stock finished in the top half of the days range and a value below 0.5 means it finished in the bottom half. A value of 1 means the stock finished right on its highs.
For mean reversion strategies I will often look for a value below 0.2 for a buy and above 0.8 for a sell. This is a good indicator to combine with other technical trading rules.
IBR = (Close – Low) / (High – Low)
Volatility Index (VIX)
The VIX volatility index measures 30-day volatility in the US stock market and it has strong mean reverting tendencies. This makes it a useful choice for incorporating into a mean reversion system.
You can’t directly trade the VIX index but you can use it as a guide to trade other instruments.
For example, when VIX is heavily oversold, volatility is low, and that can sometimes indicate complacency. This can be a good time to short stocks since investors are not prepared for a jump in vol.
When VIX is high, there may be a lot of fear in the market and that can indicate a chance to go long. Historically, big spikes in the VIX have coincided with attractive buying opportunities.
We have a system in our program that has a very high win rate using this method. However, bear in mind that volatility (particularly low volatility) can go on for long periods.
PE Ratios
A different approach to mean reversion is to look at financial ratios.
Buying a stock when the PE drops very low and selling when it moves higher can be a good strategy for value investing.
Some value investors have been known to seek out PE ratios under 10, under 5, even under 1. This works so long as you avoid ‘value traps‘.
Investor Sentiment
As mentioned previously, sentiment indicators can also identify turning points.
When too many investors are pessimistic on a market it can be a good time to buy. This can be part of a longer term strategy or used in conjunction with other rules like technical indicators.
Stop Losses
The more a market moves against you, the stronger the mean reversion signal becomes.
Therefore stop losses can be logically inconsistent for mean reversion systems and they can harm performance in backtesting.
However, stop losses should still be used to protect against large adverse price movements especially when using leverage where there is a much higher risk of ruin.
Statistics such as maximum adverse excursion can help show the best placement of fixed stop losses for mean reversion systems.
Fixed stop losses will usually reduce performance in backtesting but they will keep you from ruin in live trading.
Trailing Stops And Profit Targets
Trailing stops work well for momentum systems but they can be hard to get right for mean reversion strategies.
I have never found that trailing stops work any better that fixed stops but they may be more effective when working on higher frequency charts.
Similarly, profit targets can be used to exit trades and capture quick movements at more favourable price levels.
If using a profit target, it is a good idea to have a target that adjusts to the volatility of the underlying instrument.
For example, a target based on two or three times the ATR (average true range).
Overall, I have found that profit targets are better than trailing stops but the best exits are usually made using logic from the system parameters.
For example, if the buy rule is based on RSI, an exit rule based on RSI usually works well.
Time-Based Stops
Now and again you will get a mean reversion trade that never rebounds. Instead of a quick reversal, the stock keeps going lower and lower.
These are the worst type of trades for mean reversion strategies because you can be kept stuck in a losing trade for what seems an eternity.
In these cases, a time-based stop can work well to get out of your losing position and free up your capital for another trade.
I have found that 10 or 12 days can be enough to get out of a position that continues to drift against you.
Step Five – Initial Testing
Once you have some basic trading rules set up you need to get these programmed into code so that you can do some initial testing on a small window of in-sample data.
You must be careful not to use up too much data because you want to be able to run some more elaborate tests later on.
At this point you are just running some crude tests to see if your idea has any merit. This is before you add any other fancy rules or position sizing.
At this stage I will simply run some ‘points-based’ backtests on a couple of years of data.
No money management, no position sizing, no commissions. I want to see if the idea is any good and worth continuing.
If the idea does not look good from the start you can save a lot of time by abandoning it now and moving onto something else.
So do some initial tests and see if your idea has any merit. Don’t get too attached to a strategy that is not showing positive signs.
Step Six – Position Sizing For Mean Reversion Trading
If your mean reverting strategy passes initial testing, you can begin to take it more seriously and add components that will help it morph into a stronger model.
Position sizing is one of those crucial components to a trading system and there are different options available.
Volatility Adjusted
Position sizing based on volatility is usually achieved using the ATR indicator or standard deviation.
The idea is that you buy more shares when volatility is low and fewer shares when volatility is high. This makes logical sense since volatility determines the trading range and profit potential of your trading rule.
I’ve found this technique works well on futures contracts but I have never had much success with it on stocks. Volatility in stocks can change dramatically overnight. For instance after an important piece of news.
Equal Weighting
Equal weighting is simply splitting your available equity equally between your intended positions.
For example, if you want to invest 10% of your equity into a stock you simply divide 10% of your equity by the share price to get the number of shares you need to buy.
This is a simple method for position sizing which I find works well on stocks and is a method I will often use.
Fixed Number Of Shares Or Contracts
This approach involves trading a fixed number of shares or contracts every time you take a trade.
This approach does not allow compounding which means you can get smaller drawdowns at the expense of larger gains.
This technique works well when trading just one instrument and when using leverage. It allows you to keep your risk at an even keel.
As you gain confidence, you can increase the number of contracts and thereby dramatically improve your earning potential.
Percent Risk
To trade a percentage of risk, first decide where you will place your stop loss. Then calculate the trade size that will allow your loss to be constrained to that percentage of your bankroll – if the stop loss is hit.
This percentage is typically set at 0.5% or 1%.
Bear in mind that markets can sometimes gap through your stop loss level so you must be prepared for some slippage on your exits.
Kelly Formula
Using statistics from your trading strategy (win rate and payoff) the Kelly formula can be used to calculate the optimal amount of risk to take on each trade.
Since this is the optimal amount it can also lead to large drawdowns and big swings in equity. This is why many traders will halve or use quarter Kelly.
Just being in the ballpark of Kelly is going to give you a good position size to apply to your trades so it is worth studying the formula.
Always use conservative inputs when you calculate the Kelly formula so you don’t underestimate your risk.
This is especially true if your estimates are based on simulations and not live trading.
Factor Weighting
Factor weighting means risking more on trades that better match your buy rules.
For example, if you have a mean reversion trading strategy based on RSI, you could buy more shares, the lower the RSI value gets.
Or if you trade PE ratios, you could buy more shares of a PE 5 stock and fewer shares of a PE 10 stock.
The idea is that you buy more of a something when it better matches the logic of your system. Dynamic, factor weighted position sizing is something I have been looking more closely at and written about here.
Step Seven – Adding More Rules
Once you have your buy and sell rules sorted you will probably want to add some additional rules to improve the performance and logic of the system.
Market Timing Elements
A good place to start is to identify some environments where your mean reversion system performs poorly in so that you can avoid trading in those conditions.
There has been a lot written about the 200-day moving average as a method to filter trades. This can be applied to the stock itself or the broader market.
There are numerous other ways to use filters or market timing elements. I have found that some of the following rules can work well to filter stocks:
- Only take long trades if the stock is above its 200-day MA
- Only take long trades if the S&P 500 is above its 200-day MA
- Only take long trades if the VIX went up yesterday
- Only take short trades if the VIX went down yesterday
- Only take long trades if the TED spread is under 1
- Only take long trades if the S&P 500 is not oversold
- Use filters like Ehlers and Kalman to identify periods of momentum or mean reversion
Ranking For Mean Reverting Strategies
Often a mean reversion trading strategy requires a method to rank more than one trading signal.
This is most common when you trade a universe of stocks where you might get lots of trading signals on the same day.
Ranking for a mean reversion trading strategy might be linked to your buy rules.
For example, if you are trading an RSI system, you might want to rank by RSI as well and choose the stocks with the lowest RSI readings first.
This ensures the logic of your system is consistent.
However, don’t be surprised when a backtest defies logic. Good trading systems can often be found by chance or with rules you would not have expected.
Overall, I’ve found ranking based on RSI, ATR, and Internal Bar Range works well.
The important thing to remember is that ranking is an extra parameter in your trading system rules.
A good backtest result might be caused entirely by your ranking method and not your buy and sell rules.
Therefore you need to be careful that the ranking does not contribute to curve fit results. This is why I will often use a random ranking as well.
Run your system 100 times with a random ranking and you will get a good idea of its potential without the need for an additional ranking rule.
Other Timing Rules
Once again, there are thousands of different rules and ideas to apply to your mean reversion trading strategy.
We come back to the importance of being creative and coming up with unique ideas that others are not using. This may be your best bet to find a strategy that works.
Step Eight – Optimisations And Walk Forward Analysis
The further you progress through the steps and the more rules you add to your trading system the more concern you need to pay against the dangers of curve fitting and selection bias.
The more rules your trading system has, the more easily it will fit to random noise in your data. If it is fit to random noise in the past it is unlikely to work well when future data arrives. Future data will be new and have its own characteristics and noisiness.
Also, the more backtests you run, the more likely it is that you will come across a system that is curve fit in both the in-sample and out-of-sample period.
Just because a system has performed well in a segment of out-of-sample data does not necessarily mean it is not a curve fit strategy. You can see a good out-of-sample result by chance as well.
Optimisations
Despite these drawbacks, there is still a strong case for using optimisations in your backtesting because it speeds up the search for profitable trade rules.
By optimizing your trade rules you can quickly find out which settings work best and then you can zone in more closely on those areas building a more refined system as you go.
The key is to recognise the limitations of optimising and have processes in place that can be used to evaluate whether a strategy is curve fit or robust.
One of the simplest rules with optimising is to avoid parameters where the strong performance exists in isolation. Instead, look for a range of settings where your system does well.
For example, if you have a mean reversion trading strategy that buys 30-day lows, it should also perform well on 29-day lows, 28-day lows, 31-day lows, 32-day lows etc.
Conversely, if your system makes 40% per year buying 30-day lows but it loses money when the setting is changed to 31-day lows, that is a clear signal that the system has been curve fit for 30-day lows.
Walk Forward Analysis
Another interesting method that can be used to optimise a trading strategy is called walk forward analysis, first introduced by Robert Pardo.
This is where you separate your data out into different segments of in-sample and out-of-sample data with which to train and evaluate your model.
Your system trains itself on the in-sample data to find the best settings then you move it forward and test it once on the out-of-sample segment.
Then you step forward to the next segment of in-sample data and repeat the process.
At the end, you stitch together all the out-of-sample segments to see the true performance of your system.
Essentially, this method replicates the process of paper trading but sped up. You repeatedly test your rules on data then apply it to new data.
The advantage of walk forward analysis is that you can optimise your rules without necessarily introducing curve fitting.
It’s important to use enough data so that your system can make meaningful connections and find out what works.
It’s also important not to use biased rules. Give the system enough time and enough parameter space so that it can produce meaningful results.
Step Nine – Stress Testing And Evaluation
When you run a backtest, depending on your software platform, you will be shown a number of metrics, statistics and charts with which to evaluate your system.
As I mentioned in step three, you should already know what metrics you are looking for at this point and how you want to evaluate your system.
The first thing I will always look at is the overall equity curve as this is the quickest and best method for seeing how your mean reverting strategy has performed throughout the data set.
I will also check the monthly table of results and look at key metrics like annualised return, maximum drawdown, CAR/MDD, win rate, average profit per trade, average number of bars held, profit factor etc.
Each metric paints a different picture so it is important to look at them as a whole rather than focus on just one.
One of my favourite metrics is CAR/MDD (sometimes called MAR) which is the compounded annual return divided by the maximum drawdown.
This metric gives a good idea of the smoothness of an equity curve.
One of the advantages of this ratio is that it allows easy comparison of different strategies and when you combine two strategies together you can use the CAR/MDD ratio to easily see any improvement.
Consider Sample Size When Trading Mean Reversion
A big advantage of mean reversion trading strategies is that most of them trade frequently and hold trades for short periods.
This is perfect because it means you can generate a large sample of trades for significance testing and stress testing.
Generally, I’m of the belief that the more stress testing you put a strategy through the better and there are numerous techniques that can be used.
Test Out-of-Sample Data
As mentioned already, it’s common practice to backtest your system on in-sample data and keep some data free so that you can test it once on clean data.
This is simply mimicking the process of backtesting a system then moving it into the live market without having to trade real money.
Using out-of-sample data can be considered a good first test to see if your strategy has any merit.
You need to have enough data to see a good sample of trades.
Out-of-sample data can be reserved before and after your in-sample period, or both.
Test Different Data Windows
It’s also a good idea to segment your data and test it on different data windows. This allows you to test different market conditions and different start dates.
Some strategies suffer from start-date bias which means their performance is dramatically affected by the day in which you start the backtest.
Low turnover systems, for example momentum portfolios, hold stocks for months at a time.
If you start your backtest on the first of January you will likely get a different portfolio than if you started it a few days later. That can result in a significant difference.
Test your system on different dates to get an idea for worst and best case scenarios. See how it performs in the 2008 crash or the 2017 melt up.
The underlying trend is going to be one of the biggest contributors to your mean reversion algorithm returns both in the in-sample and out-of-sample.
Walk forward analysis is another way to test different data windows in a step by step process.
Keep The Number Of Testable Parameters Small
The more parameters (trading rules) your system has, the more equity curves can be generated so the better your chance of finding a good backtest result.
However, this comes at a cost because the more parameters you have, the more easily the system can adapt itself to random noise in the data – curve fitting.
Mean reversion strategies that have fewer trading rules require smaller sample sizes to prove they are significant.
Data is always at a premium when backtesting so it’s better to build strategies with as few rules as possible. Often, this is a trade-off.
Look For A Range Of Variables
As I mentioned earlier in the optimization part, don’t accept trading rules that exist in isolation.
If a system works well with 30-day lows it should also do well with 29-day lows.
Small changes in the variables and parameters of your system should not dramatically affect its performance.
Test Other Markets
You can test your mean reversal strategy on different time frames, different time windows and also different markets.
A mean reversion trading system that works on Apple, doesn’t necessarily have to work on Microsoft.
But if it does, it provides an extra layer of confidence that you have found a decent trading edge.
Use Monte Carlo Analysis
Monte Carlo can refer to any method that adds randomness. The careful use of randomness can be used to reverse engineer your system and help evaluate your system in a number of different ways.
For example, Monte Carlo can be used to:
1. Randomize the sequence of trades
This let’s you see how the system would have performed if trade results came in a different order.
It’s possible that your system only performed well because the trades lined up in the perfect sequence. You are unlikely to get that same sequence in the future so you need to be sure your system works based on an edge and not on the order of trades.
To implement this, take your original list of trades, randomize the order 1000 times then observe the different equity curves and statistics generated.
This will give you a better idea of drawdowns and returns that you can expect going forward.
Here is an output from Amibroker of this process:
2. Add random noise to the data or system parameters
You can also get an idea if the system is too closely tuned to the data by adding some random noise to your data or your system parameters.
Regarding parameters, you can test your system and optimise various input settings. Just like an indicator optimisation.
For randomising the data, one method is to export the data into Excel and add variation to the data points.
For example, use the RAND() or RANDBETWEEN() function in Excel and vary 30% of your open, high, low and close prices by 30% of the average range (ATR).
Here is one way to do it:
Then, export the data back to your software and run the system on the new data source.
If you can, do this a large number of times and observe the equity curves that are generated on new sets of noisy data. See if your system holds up or if it crashes and burns.
Your system is unlikely to perform as well as on your previous test but if it crashes and burns completely, that’s another sign that your system was curve fit to the original data.
As mentioned before, small changes in the data or in the parameters should not lead to too big changes in system performance.
Compare Equity Curves
Along the same lines, there are all sorts of ways to compare statistics and equity curves.
The most simple way is to compare your system to a benchmark like buy and hold.
If you cannot produce better risk-adjusted returns than buy and hold there is no point trading that particular system. It should be a valid benchmark though, it doesn’t have to be the S&P 500 every time.
It is important to take the underlying trend into consideration. If you backtest a long only system during a major bull market it shouldn’t be a surprise that it does well.
One option, described in detail by David Aronson, is to detrend the original data source, calculate the average daily returns from that data and minus this from your system returns to see the impact that the underlying trend has on your system.
You can also compare your system to random equity curves.
Take the original data and run 1,000 random strategies on the data (random entry and exit rules) then compare those random equity curves to your system equity curve.
Usually what you will see with 1000 random equity curves is a representation of the underlying trend.
If your system cannot beat these random equity curves, then it cannot be distinguished from a random strategy and therefore has no edge.
It is also possible to construct forward projected equity curves using the distribution of trade returns in the backtest. This can give you another idea of what to expect going forward.
These techniques are not easy to do without dedicated software. Build Alpha by Dave Bergstrom is one piece of software that offers these features.
Common Sense Testing
Overall, you should use some common sense when putting your strategy through its paces.
If it performs well with a 10-day exit, test it with a 9-day and 11-day exit to see how it does. Vary the entry and exit rules slightly and observe the difference.
If it works well during bull markets, see how it does in bear markets.
I will often test long strategies during bear markets (and vice versa with short strategies) with the view that if it can perform well in a bear market then it will do even better in a bull market.
Put the system through the wringer.
You want to get to know your system as well as possible before you take it live.
Lastly, one of the simplest ways to build more robust trading systems is to design strategies that are based on some underlying truth about the market in the first place.
The turn of the month effect, for example, exists because pension funds and regular investors put their money into the market at the beginning of the month. (Individual investors often have more money to invest at the start of the month).
That’s a fundamental explanation for a trading edge based on investor behavior. It gives the strategy more credibility. This mean reverting strategy has also stood the test of time.
Not all trading edges need to be explained. But patterns that you cannot explain should be evaluated more strongly to prove that they are not random.
Step Ten – Live Trading And Feedback
The final step when building your mean reversion trading strategy is to have a process set up for taking your system live and then tracking its progress.
Importantly, you should know the answers to some key questions before going live such as:
How will you execute trades and what type of orders will you use?
When you trade in the live market, your price fills should be as close as possible to what you saw in backtesting.
Your backtests should also compensate for details like commissions and slippage so that you don’t get too many nasty surprises when you transition to live trading.
Since I use Interactive Brokers I will usually set my commissions to $0.01 or $0.005 per share but yours will depend on the broker you use.
Limit orders often work well for mean reversion systems because they can provide better price fills when a market is falling/rising quickly.
You should also be aware of the capacity of your trading strategy. If you are trading illiquid penny stocks, you cannot simply buy thousands of shares of stock without affecting the spread.
You should know the capacity of your trading strategy and you should have accounted for this in your backtesting before you take it live.
What if something goes wrong?
As with so many things in life, it pays to have a backup plan in case things go wrong.
If your trading strategy is spiralling out of control or the market is going crazy, you should have a way to turn things off quickly. Some brokers, Interactive Brokers included, have commands you can use to close all positions at market.
With automated trading strategies, they should ideally run on their own dedicated server in the cloud. Also with a backup service.
If they are not cloud-based then you should consider having a backup computer, backup server and backup power source in case of outage.
How will you track your progress and analyse your results?
One of the most important parts of going live is tracking your results and measuring your progress.
Whenever you take a system live it’s unlikely that everything will go smoothly and your results will mimic your simulations exactly.
The first question to ask is whether your trading results are matching up with your simulation results. If not, you will need to go back to the drawing board and work out what’s happening.
If things are moving relatively smoothly you can start to track your progress.
Keep note of your maximum drawdown and win/loss sequences and compare them with your simulations.
If the maximum number of losing trades during your backtesting was eight in a row and all of a sudden you’ve hit that number after just a couple of weeks, there’s a good chance that the system is not doing what you expected.
The same goes for your drawdown. You should know what kind of result will drive you to turn off your system and then stick to it.
A smarter way to track your progress is to use monte carlo again. Imagine that the straw bloom monte carlo equity curves that we looked at earlier were extended out for another 100 trades.
If your equity curve starts dropping below these curves, it means your system is performing poorly. If your equity curve falls below the bottom 5% of random curves (or reshuffled curves), it’s a strong signal to turn it off.
Overall, make sure feedback is an integral part of your trading system approach. Use it to improve both your trading system and your backtesting process.
You can use the experience from live trading to produce more accurate backtests in the future.
Quant Mean Reversion Strategy Example
I didn’t intend for this article to be so long! But I did want to include a practical example of a mean reversion algorithm that can be used to trade stocks.
This mean reversion trading strategy is intended for S&P 500 stocks.
It’s been backtested with data that incorporates historical members and has been adjusted for dividends and corporate actions. Results also include commissions of $0.01 per share.
Note that this system is not intended to be traded. It is just an example I came up with in a couple of hours of backtesting.
The rules are as follows:
Buy Rules:
- RSI(3) < 15 for 3 consecutive days
- IBR < 0.2
- Close is above 200-day moving average
Sell Rules:
- IBR > 0.7
- Stop Loss of 5%
Additional Rules/Information:
- All trades executed on the next day open
- Maximum of five open positions
- Starting capital: $50,000
- Position Size: 20% (equal weighting)
- Commissions: $0.01 per share
- Ranking: RSI(3)
- Margin: None
Example Trade Setup
Following is an example of the trade setup we are looking for with this strategy.
On the 20th January 2017, the mean reversion indicator RSI(3) has been under 15 for three consecutive days and the stock has closed near its lows with an IBR score of 0.07. We therefore go long on the next open which is the 23rd January (green arrow).
We get a strong close on the 24th January and IBR is now 0.72. We therefore close our trade on the next market open for a profit of 3.15% after fees (red arrow).
The idea behind this mean reversion example is that we want a stock that is holding oversold for a good few days as these are the most likely to spring back quickly.
We don’t want to wait long to take profit so we are going to exit on the first decent up close.
We are looking for a pullback within an upward trend so we want the stock to be above its 200-day MA.
Strategy Results
Backtesting this mean reversal strategy on S&P 500 stocks between 2002 – 2018 we get the following results and equity curve. Our equity curve includes two out-of-sample periods:
- # Trades: 1579
- Net Profit: $121,296
- CAR: 8.00%
- MDD: -12.78%
- CAR/MDD: 0.63
- Win Rate: 64.34%
- Avg. Profit Per Trade: 0.41%
- Risk Adjusted Return: 36.92%
Following is a monthly table of results, a drawdown graph and a monte carlo reshuffle:
System Observations
This quant mean reversion strategy is just a simple example but it shows off some of the characteristics of a good mean reversion system.
We have a high number of trades, a high win rate and good risk adjusted returns. This system may be worth exploring further and could be a candidate for the addition of leverage.
More Advance Mean Reversion Ideas
If you are stuck on ideas for how to make your own mean reversion trading strategy more unique, consider these additional ideas:
Read Through Academic Papers
It is often a good idea to read academic papers for inspiration. You can simply go to SSRN.com and search for the keyword ‘mean reversion’ or ‘mean reversal strategy’.
This one called Profitable Mean Reversion After Large Price Drops details a mean reversion trading strategy that produced upwards of 200% per annum in simulations. I think the authors have made a mistake in their execution assumptions here but even so this is an interesting read.
Our Financial Research Spreadsheet contains over 400 research papers and makes this process of finding new research easier.
Try Intermarket Filters
Although I briefly discussed the use of the VIX and the broader market to help with the construction of trading signals, there are many more instruments out there that can be used to help classify mean reversion trades. These are often called intermarket filters.
Consider using currencies like USD and GBP. Commodities like gold and oil. Economic indicators like the yield curve and GDP. Perhaps measure the correlations between them.
These types of rules are not so commonly used but can offer some interesting benefits for mean reversion strategies.
Try Alternative Data
Another option is to consider alternative data sources. For example, event data, news sentiment data, fundamental data, satellite imagery data. Many different data sources can be purchased from the website Quandl.
One of the trading ideas in our program is a simple mean reversion strategy for ETFs which has been enhanced with an additional rule sourced from an alternative database.
Behavioural Biases/Liquidity Shocks
Brainstorm some ways you can quantify behavioral effects or methods for predicting liquidity shocks. For example in the run up to big news events.
Small details may give your trading system an edge and allow it to be executed at the most opportune moments.
Final Thoughts
One thing that I have found to be true about mean reversion is that a good mean reversion trade requires things to stay the same.
When a stock drops 10 or 20 percent there is usually a reason and you can usually find out what it is.
If it’s dropped for a major reason; such as a structural change or if there’s real game changing news, the chances of that stock snapping back quickly and giving you a profit is much smaller.
When this happens, you get momentum and this is obviously the enemy of a mean reversion strategy.
But other times, a stock can drop sharply for less obvious reasons. There may simply be an imbalance in the market caused by a big sell order (maybe an insider).
Or the stock may drop due to an overreaction to a short-term event (such as a terrorist threat, election result or oil spill).
These are often the most opportune moments for mean reversion trades. We get a big move but really, not an awful lot has changed.
So mean reversion strategies requires things stay the same. You don’t want structural, intrinsic change when making a mean reversion trade but you do want overreactions and illogical price movements.
If you can find ways to quantify that you will be on your way to developing a sound mean reversion trading strategy.
Thank You For Reading.
Great comprehensive insight into mean reversion Wish there were a PDF download for ease of reference offline
Keep it up JB
If you use a browser like Chrome you can press CTRL+P and then choose print to PDF. Alternatively you can use a website/extension like printfriendly.com. I find it works pretty well.
Wonderful article, focused and concise! I’ve been working with mean reversion strategies for about 3 years now, and this great paper summarises the best points I’ve leant from hundreds of sourses. Great job!
Thanks, glad it helps.
Hi Joe,
thanks for a very comprehensive post.
Certainly will keep me busy for quite a while!
Cheers,
Ola
Cheers Ola
Very comprehensive! Will indeed read several times!! And clearly written. Kudos!
Thanks for reading Dan
This is by the far the best freely available article on how to build a mean reversion strategy I’ve read on the Internet –
Probably a question of preference but I prefer to leave position sizing out of the equation when testing, I like to use an equal weighting scheme to use as a benchmark and run MC to determine hypothetical optimum position size based on my objective function. This is then repeated during live trading so it acts as a dynamic position sizing and accounts for under performance by reducing the position size.
One may also want to look at higher time frame or other ideas such as determining market regime and / or performance of several indicators used on the same security and only trade the best performing based on short term statistical measures.
Thanks for your research and great blog !
Yes, I also start with equal weighted position sizing. Hard to beat. And non-compounded pos sizing for monte carlo is a must.
great stuff great summary. check rsiconnors (2) for trailing sl start when rsi gets into OBOS (overb overs) until it gets out hitting or not hitting sl. roc (2) for entry when roc flips changes direction but only in OBOS zone derived from rsi.
Very informative and comprehensive article. I have been trading a manual mean regression strategy, in the crypto market, with very good returns for the past 14 months. I am now looking to automate my strategy and RSI overlay is simply amazing. Thank you very much for this article !
No problem, hope things are going well in the crypto market.
Thank you very much for this detailed mean reversion article.
I enjoyed it very much.
Glad to hear that.
I think the VIX section contains an error. If the VIX is overbought it would imply stocks were oversold. Therefore if the VIX was overbought you would buy stocks, if it was oversold you sell stocks . other than that great article, I thank you, please keep posting.
I have corrected it, thanks.
this is a very well written article. The research and information is of superb quality. thank you for posting.
Thank you
An excellent article written by a committed researcher that attentively cared to incorporate minute details of methods of data cleaning to strategy building! It needs goosebumps of energy and analytical skill! I am new to this mean reversion. I have been trading full time using simple indicators like Stochastics, EMA and MA. I found ALMA and McGinley dynamic are better than EMA and MA. With these indicators, combined with Volume chart and Psar I am able to make profitable trades most of the times. But mean reversion appears to be far superior technic and I will start using it now. But no complicated data collection, cleaning and analysis. No time for such laborious job.
Can you briefly describe your strategy?
Very nice post! Really did give me alot of idea to build strategies.
Thanks.
thankyou
Joe, a truly fantastic read, comprehensive, crisp and to the point throughout. I have a question regarding the methods to filter a universe of stocks.
You mentioned one of the approaches is to identify periods of momentum or mean reversion using Ehlers or Kalman Filters. I am interested to delve into this approach, where can I find additional resources to explore this approach further??
thanks, Joe
Hi Sai, thanks for your comment. I recommend you start with some of the books by John Ehlers such as Cycle Analytics for Traders. You can also visit his website Mesa Software. Also, you can find information on Kalman filters on Google. Cheers!