In this article I explain the RSI technical analysis indicator for stocks. I then test the indicator on historical stock market data in order to analyse its effectiveness.
The relative strength index (RSI) is a technical analysis indicator (or more specifically a momentum oscillator) that is used by traders to measure periods of strength and weakness in a stock or security.
Developed by J. Welles Wilder and first published in his 1978 book, New Concepts in Technical Trading Systems, the RSI has become an extremely popular indicator. The indicator itself is based on closing prices and is measured over a certain number of trading periods or bars. Most commonly, traders use the 14 period RSI to detect whether a market is oversold or overbought.
Whereas momentum calculates the rate of movement in a stock, RSI measures the velocity and strength of those recent price movements and calculates the ratio of higher closes to lower closes. Stocks that have more (or stronger) upward movements are assigned a high RSI value while stocks that have more (or stronger) downward movements are assigned a low RSI value.
Using the below formula, an oscillator can be formed with values ranging from 0 to 100:
RSI = 100 - 100 / (1 + RS)

RS = Average of x days' up closes /  Average of x days' down closes
RSI is most commonly used by traders on a 14 day timeframe. A close above 70 typically indicates the stock is overbought, whereas a close below 30 indicates the stock is oversold.
Occasionally a stock might also close above or below 80 or 20 and this indicates a more extreme period of overbought or oversold (or momentum – depending on how you look at it). Sometimes, a stock will cross 90 or 10 but this is a rare occurrence, particularly on a daily chart.
How to use the RSI in stocks and shares
These days, nearly all charting software comes with the RSI indicator fully loaded in, which means using the indicator to find opportunities is a breeze.
It’s possible to modify the number of periods and use the RSI on various timeframes, however, it’s best to stick to the default parameter of 14. This is the period recommended by Wilder, and since most traders use this number, it probably gives the best chance of success – due to the idea of self-fulfilling prophecy.
Wilder created this indicator because he recognised that when prices fall or rise very rapidly, a reversal often occurs soon after.
When the RSI crosses 70, it often signals a short-term top in the stock, and when RSI crosses 30, it often signals a bottom. The neutral level of 50 indicates that there is no directional movement.
Divergences in the RSI
As well as indicating periods of strength and weakness, Wilder thought that divergence between price action and movement of the RSI was a very clear sign of an upcoming reversal.
For example, when price makes a new high but RSI make a lower high, it’s a bearish signal, and indicates the stock is losing momentum, ready to turn back the other way. And when price hits a new low but RSI hits a higher low, it’s a bullish sign and suggests the stock is primed for a rebound.
Failure swings
As well as this, Wilder also talked about “failure swings”, where a stock would move into oversold or overbought territory but fail to maintain momentum.
As an example, consider a stock that hits 78, then pulls back to 73. It then rises to 79 but drops back down to 72. This would be considered a failure swing and is another good sign of a reversal.
Back-testing the RSI in stocks
Over the years, there have been many adjustments and variations to the relative strength index indicator, but the concept behind it has stayed much the same.
Using back-testing software from Amibroker and historical stock data from Premium Data, we can now put this famous indicator to the test and see how it has performed over the last 20 years on various stocks.
Test one – overbought/oversold
For this first test we will buy Apple $AAPL stock whenever the RSI(14) crosses under 30 and we will sell when the RSI(14) crosses over 70. We will invest $10,000 into each trade and trades will be made on the next day open. Commissions will be set at $0.01 per share to mimic transaction fees and slippage.
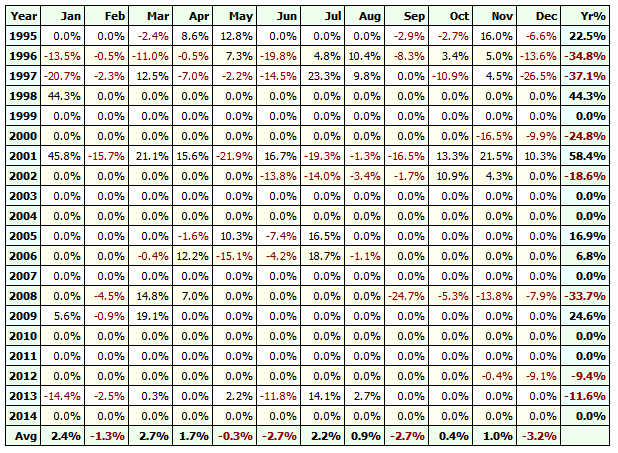
The following graphic shows the trades made when using this strategy on Apple between 1995 and 2015.
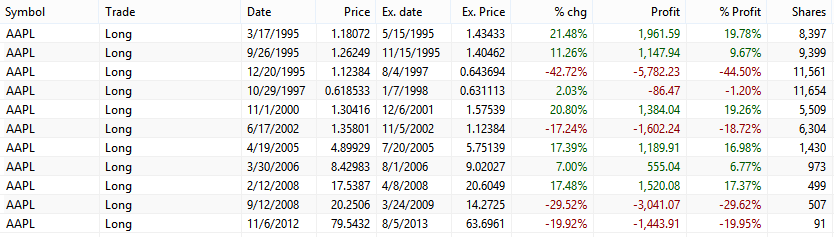
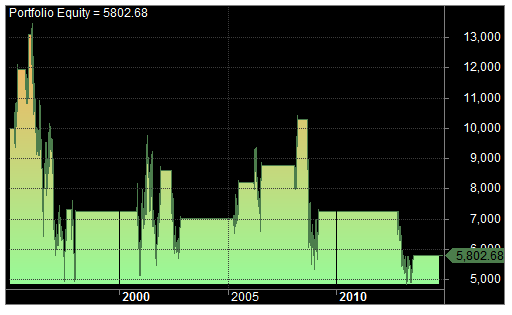
As you can see, the strategy did poorly and resulted in a loss of -$4,197.32. The following graphics show the full results and equity curve from the strategy.
![]()
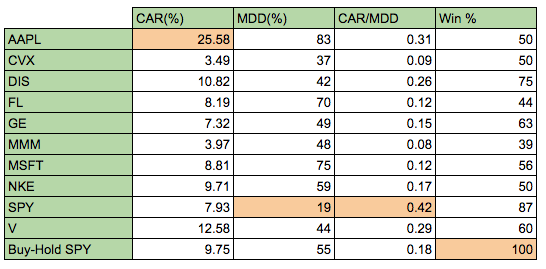
Next up, I applied the same strategy to a selection of different markets over the same period. These tickers were chosen at random. CAR = compounded annual return. MDD = maximum drawdown.
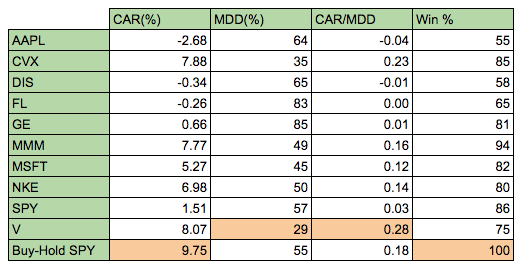
As you can see from the results, the RSI strategy tends to have a high win rate but also a large drawdown. The strategy works best in stocks that have seen choppy price action. Stocks with strong upward trends (like Apple) did not fare so well.
Overall, there seems little to be gained from using this RSI strategy over the classic buy-and-hold method.
Test two – as a portfolio
I now take test one a step further and apply it as part of a portfolio. So, whenever a stock crosses under 30 (or 20) we add it to the portfolio and when it crosses over 70 (or 80) we sell it. Our starting capital is split equally to allow a maximum of 20 different stocks from the S&P 500 universe (including delisted securities) between 1995 and 2015. Signals are ranked by RSI.
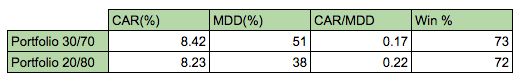
As you can see, the portfolio strategy had a high win rate but overall it did no better than buy and hold.
Including shorts
At this point some of you may be wondering why I have not included shorts in these tests. i.e. short a stock when it hits 70 and cover when it hits 30. The answer is that including short positions seriously kills the strategy resulting in losses in nearly every case.
Test three – divergence
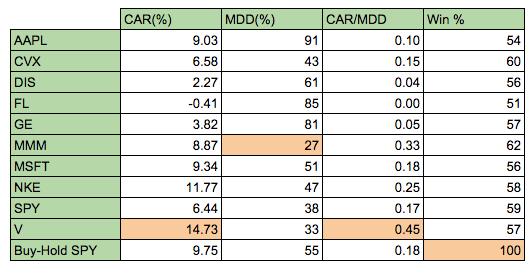
In this test, we want to look at divergence. So we are going to buy a stock when it makes a higher high than the day before but closes with a lower RSI than the day before. We will sell the stock when it makes a lower low than the day before but closes with a higher RSI than the day before. This is the classic example of divergence in RSI.
Using the same system settings as before and running this strategy produces the following results on our table of 10 stocks:
And using this strategy as a portfolio (using the S&P 500 universe) produces the following results:
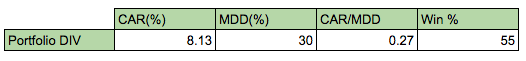
The results for the divergence method were not too bad, better than test one, but nothing to write home about.
Test four – switching it around
In this test, we switch it around and buy a stock when it crosses over 70 and we sell when it crosses under 30. In essence then, this is a momentum strategy where we go long stocks with high momentum. Applying this to our table of 10 stocks produces the following results:
Now we can run the portfolio strategy using the S&P 500 universe of stocks and we get the following results:
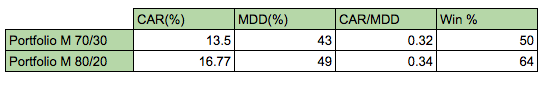
Here is the equity curve for our best performing strategy (go long stocks when RSI crosses 80 and sell when cross under 20):
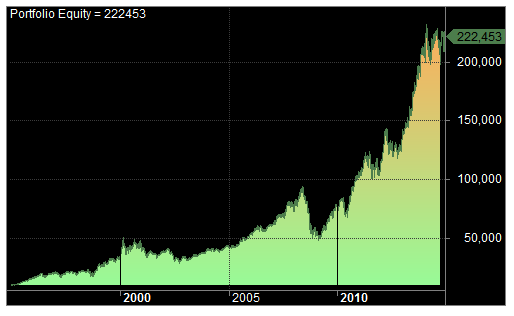
As you can see, by using the RSI in reverse, results improve quite dramatically.
Conclusion:
Overall, the results indicate that using the RSI in stocks, as part of a long-only strategy can have profitable results. However, when you factor in the difficulties associated with trading systems, such as the possibility of greater slippage and costs, then the returns may not seem strong enough to make this a worthwhile strategy to pursue when compared to the simplicity of buy-and-hold.
If anything, using the RSI in reverse (i.e. as a momentum strategy) works much better than as a mean reversion strategy, what it was originally designed for. Traders are advised to do more investigation into this, however, as $0.01 for slippage may not be enough for some markets.
The RSI shares other uses as well (such as a trend filter or as a ranking mechanism). So all in all, RSI is definitely a useful indicator to have in the toolbox. But like any technical indicator it must be used intelligently.
Thanks for reading.
Tests made with Amibroker using data from Norgate Premium Data.
Hi JB —
You will find better mean reversion results if you allow the lookback length of the RSI to vary. In particular, try values of 2 or 3.
Also, be careful when selecting issues to avoid “selection bias”, particularly when using a long-only model. A truer test results from issues that are net flat over the test period. Or include the short-only version as well.
Any long-only model shows good results for aapl (and the other issues mentioned in this posting) 1995 through today.
For example, use SPY as the issue to be traded and the period 1/1/199 through 1/1/2012.
Best regards,
Howard
Thanks Howard,
I wanted to test RSI(14) because I believe that is what most traders use. I will likely update the article at some point and look at shorter lookbacks as you suggest. Should be interesting.
Regards
JB
Hi JB,
Having an issue downloading the code for this blog, can you please check the link
Thanks in advance
Glenn
Hi Glenn
I have checked the links and I can’t see a problem.
Regards
JB
Thanks JB, still having an issue attempting to locate the code, the screen goes through a refresh process and return back the original page, I’ve tried this from 3 different PCs all with the same results, All PCs running IE 11. Is it possible to send me the code direct?
Thanks in Advance
Glenn
Hi Glenn
Sorry to hear you are having problems, I don’t know why that is happening. I’ve sent you an email so you can download the code.
Many thanks
JB
I’m having some trouble reproducing your Test #3 – Divergence. For what I can compute, there are no divergent days (i.e. closing higher than the day before and with RSI14 lower than the day before) subsequent days in AMZN, MSFT, or MMM since 2009. Multiplying first-order discrete differences returns all positive resutls. I must be doing something wrong.
How many issues are you testing on? If you’re only testing on a few companies you might not see any. It’s a rare pattern but does occur now and again.