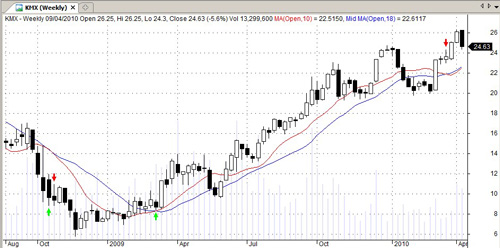
In my book, I detailed 20 original trading systems and tested those systems on historical stock data going back to the year 2000. Some of those systems produced reasonable results and indicated promise for future trading. Many were able to capture some nice trends like this one in CarMax Inc:
However, one back test is not enough and it’s necessary to scrutinize the system as much as possible before taking it live.
How to scrutinize and improve a trading system
In this post I look at how we can further scrutinize and improve a trading system. This information should be useful for analysing any system, whether you have created it from scratch or bought it from a third party.
The first step is to work on weaknesses in the system itself.
Start date bias
The biggest weakness with the systems described in my book is one of start date bias.
In other words, because each system buys a basket of 10 stocks on a particular date (1/8/2000), returns are extremely dependent on just which 10 stocks are bought at that time.
If the system started on the 1st September, instead of the 1st August for example, the basket of stocks bought would likely be very different. And, therefore, the type of return achieved could also be very different.
Unfortunately, the problem of start date bias cannot be completely overcome but there are some things we can do to make our results more reliable.
Move the start date
The most obvious choice is to step the system forward or backward and try different start dates. If the system performs in a similar fashion then it suggests it is robust.
If it performs poorly from different start dates then the good returns experienced previously are mostly likely a result of simply landing a lucky start date.
To take this further, let us take system 8 from the book, called ‘Breakout with EMA confirmation‘. This is a simple breakout strategy that uses an EMA crossover as a filter for trades. Actual statistics from my test of this system produced a CAR of 17.49% with a maximum drawdown of 27%.
If we move the start date forward by 6 months the system starts on the 1st February 2001 instead of the 1st August 2000. We get the following results:
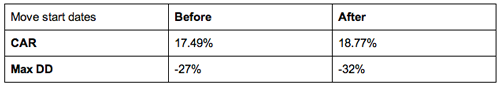
As you can see, the start date doesn’t affect this system all that much.
Moving the test forward six months actually resulted in higher 10 year returns of 18.77% CAR, although maximum drawdown increased to -32%.
It therefore follows that the system is not significantly dependent on a lucky start date. That’s good news for this particular system.
Try different watch-lists
Another step to test the robustness of a system is to test it over different stock universes or watch-lists.
As I’ve said, the system’s returns are to a large extent reliant on the stocks that the system first holds.
Therefore, if we change the watch-list, we can see if the system performs as well on different numbers of stocks.
For example, instead of testing the system over the 500 stocks in the S&P 500, you could try testing it on 10 groups of 50 stocks or 50 groups of 10 stocks. Or you could run it over different stock markets such as the Nasdaq or London’s FTSE 100.
To test this, let us take System 8 again which was run over the whole universe of S&P 500 stocks and test it over 10 groups of 50 stocks instead.
As you can see from the table, the system did not perform as well over the individual watch-lists. The average CAR was lower and drawdown went up.
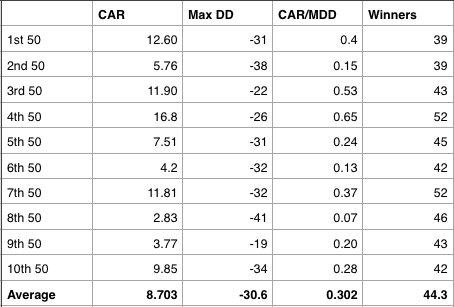
This suggests that the system does not perform so well on smaller watch-lists.
This could make sense since trend following systems work best when they are able to take advantage of lots of signals.
On the plus side, not one test lost money so this could be a good one for further optimisation.
We can further analyse the system by looking at the performance of individual tickers. Maybe some stocks just don’t trend and therefore could be left out of the watchlist? Maybe we could find a way to exit stocks that are not going in any direction?
Delisted stocks
As I stated previously, system traders also have the problem of incorporating delisted stocks into their back tests. This is a problem because delisted stock data can be expensive and hard to organise.
System traders have the difficulty of estimating how many stocks were taken off which exchange during the time period and incorporating them into the analysis.
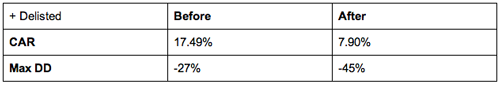
Not all trading systems are affected when incorporating delisted data but to test this further, I took system 8 again and tested it on data that included delisted stocks.
For this test, I took a total watchlist of 4000 US stocks and included 1500 delisted stocks from the time period.
As you can see, incorporating the delisted tickers caused returns to fall significantly to just 7.90% CAR. Drawdown also went up to -45%.
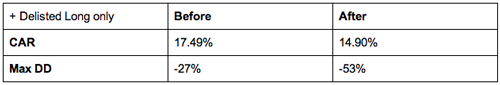
I then wondered what would happen if I got rid of short positions altogether and the results were quite interesting.
You might expect short positions to help a system that trades delisted stocks but the opposite was the case.
As you can see from the table, trading the same system long only led to higher returns of 14.90% CAR. An encouraging sign.
These are just some of the steps to take when scrutinizing a trading system. The more pressure you put it under, the better it will perform when you take it live.
There is just one more prejudice that traders need to deal with which I will discuss now.
Is the data really out of sample?
In my book, I stress the importance of keeping some data out of sample and I believe I was correct in doing so. Keeping the data clean from contamination is the best way to test a system once it has been developed.
However, it is important to bring to light that no stock data is ever completely out of sample.
For example, I may not have back-tested any data between 2010-13 and I may not have knowledge of how each stock performed over that time. But, I do know what happened to the overall market during that time.
Since I take an interest in the markets I already know that the broader market was choppy in 2011, strong in 2012 and even stronger in 2013 and that gives me a bias when back-testing. Just like I know that in 2008 we had a big crash and in 2000 we had the tech bubble.
This is a bias that cannot be overcome no matter how scrupulous you are with data mining principles and keeping your data separate.
This is why it is so important to paper-trade live and why there will always be some risk involved with financial trading.