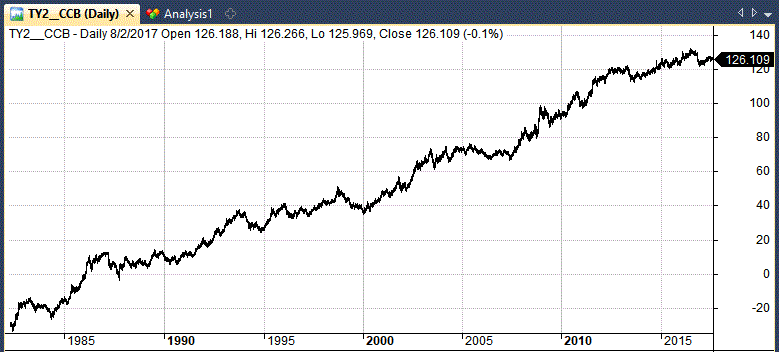
After a period of some thirty years of increasing bond prices, and with the Federal Reserve committed to a policy of gradually increasing interest rates, the time for long-based trading strategies on US treasuries could well be coming to an end.
Many, including former Fed chairman Alan Greenspan, have called the bond market a bubble ready to pop. With this in mind, this article presents a simple trading strategy that shorts the US ten year note using the ATR (average true range) indicator.
Trading System Rules
The rules behind this trading strategy are straightforward.
We are going to short the US ten year note futures contract after an up day and when the short-term ATR(2) is 20% higher than the medium-term ATR(12).
Thus, we are attempting to short the futures contract after a modest uptick in volatility.
We will hold the position for one full day and then close our position on the next open.
There is not necessarily a fundamental reason for this strategy but it is shown to work reasonably well in backtesting.
The precise rules are as follows:
• IF ATR(2) > (ATR(12)*1.2) AND Close > Open THEN go short on the next open;
• Cover after one full day – on next open;
Trade Example
Following is an example of the kind of trade setup we are looking for:
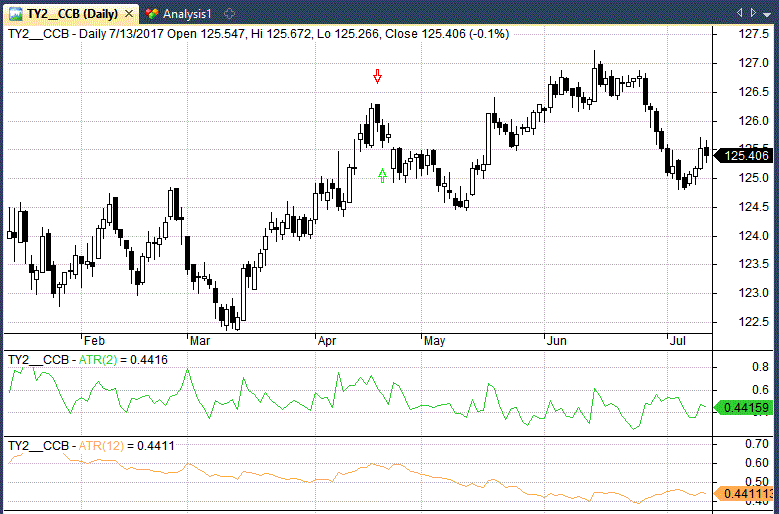
On the 18th April 2017, ATR(2) (green) was 0.732 and ATR(12) (orange) was 0.598. So ATR(2) was more than 20% above ATR(12). We also had an up close on that day.
We therefore go short on the next bar open (red arrow).
We hold the trade for one full day then exit on the next day open (green arrow) giving us a profit of $340 from one contract (after deducting $20 in transaction costs).
Backtest Settings
To backtest this system I will be using Amibroker software and futures data from Norgate for the ticker symbol TY2__CCB.
All trades will be placed on the next day open and position size will be set at one contract with no compounding.
Starting capital will be $50,000 and transactions costs will be set at $10 per trade.
No stop loss will be used at this stage as we are using a time-based stop of one day.
In Sample Results
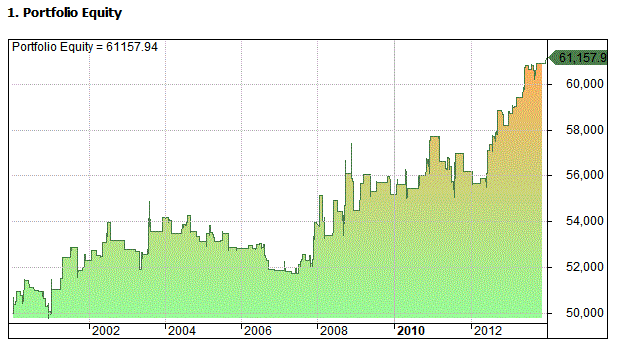
Running this system on the ten year note futures contract between 1 January 2000 and 1 January 2014 we recorded the following results and equity curve:
Net Profit: $11,157.94
CAR: 1.45
MDD: -5.72%
CAR/MDD: 0.25
# Trades: 196
Win Rate: 51.53%
Average P/L Per Trade: 3.57%
Profit Factor: 1.34
Sharpe Ratio: 1.24
Out Of Sample Results
One method to validate a trading system is to step it forward and test it on unseen data similar to what would be experienced in real trading.
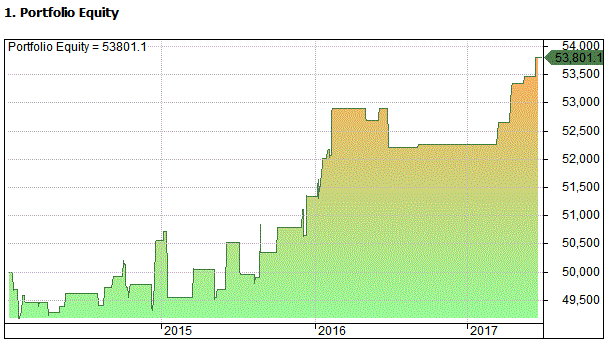
Moving this system forward and running on an out-of-sample period between 1 January 2014 and 1 July 2017 we recorded the following:
Net Profit: $3801.10
CAR: 2.12
MDD: -2.37%
CAR/MDD: 0.90
# Trades: 49
Win Rate: 63.27%
Average P/L Per Trade: 4.86%
Profit Factor: 1.61
Sharpe Ratio: 2.16
Observations So Far
The system shown so far has produced good risk-adjusted returns in the in-sample and out-of-sample test. In fact, the system was able to perform better in the out-of-sample than the in-sample.
Particular attention should be made to the profit per trade and the Sharpe ratio. Although the annualised return is low this can be substantially improved by increasing the number of contracts.
The number of trades is quite small and we would ideally want a larger sample size. The system is still very basic and could easily be enhanced with more features.
Walk Forward Optimisation
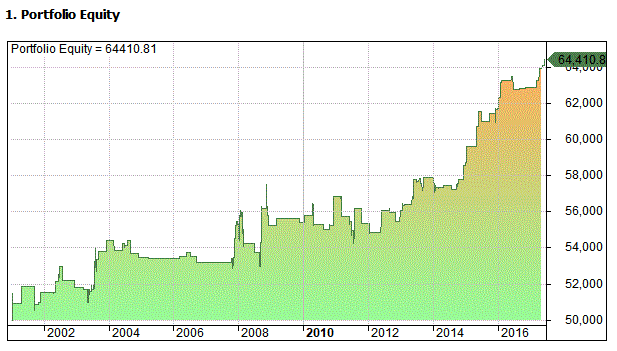
The system was also run via a walk forward optimisation whereby the the slow ATR and percentage multiplier was optimised and walked forward in steps of 1 year in sample with 3 months out-of-sample.
The following results and equity curve were produced:
Net Profit: $14,410.81
CAR: 1.55%
MDD: -5.65%
CAR/MDD: 0.27
# Trades: 149
Win Rate: 59.73%
Average P/L Per Trade: 6.06%
Profit Factor: 1.58
Sharpe Ratio: 1.97
Final Thoughts
The trading system we have discussed shows some interesting characteristics and potential for trading.
Short systems are always valuable to traders because they can help smooth drawdowns when combined with long only models.
As always, there are still issues to be aware of. The trade sample is fairly small and there is a higher risk of curve fitting with single issue trading systems.
However, this is balanced by the positive walk forward results and the fact our system has produced profitable results during poor market conditions. i.e. the system has made money trading against the prevailing trend.
If Alan Greenspan is right, the raging bull market in US treasuries could well be coming to an end and so a strategy like this may be a good one to keep an eye on.
Amibroker Code
Following is some Amibroker code for the strategy as shown above:
/* /* Disclaimer: Futures trading carries a high degree of risk.This code is provided for educational purposes only. Full disclaimer and risk warning applied. ©JBMARWOOD.COM.*/
SetFormulaName("ShortBonds");
SetOption("AllowSameBarExit", 0);
SetOption("MaxOpenPositions",1);
SetTradeDelays(1,1,1,1);
Buy = Sell = Short = Cover = 0;
BuyPrice = ShortPrice = O;
SellPrice = CoverPrice = O;
NumContracts = 1 ;
PositionSize = NumContracts * MarginDeposit;
ATRSlow = Optimize("ATRSLOW",12,2,40,2);
ATRMulti = Optimize("ATRMULTI",1.2,1.2,4,0.1);
Short = ATR(2)>(ATR(ATRSlow)*ATRMulti) AND C>O;
Cover = 0;
ApplyStop(stopTypeNBar,stopModeBars,1);
//////////////////////////////////////////End
Simulations: Amibroker
Data: Norgate

Thanks for sharing this idea JB. Definitely an interesting one. I also appreciate what you’re saying about how it could be combined with a shorter-term system to diversify results and smooth out the equity curve. Thanks again!